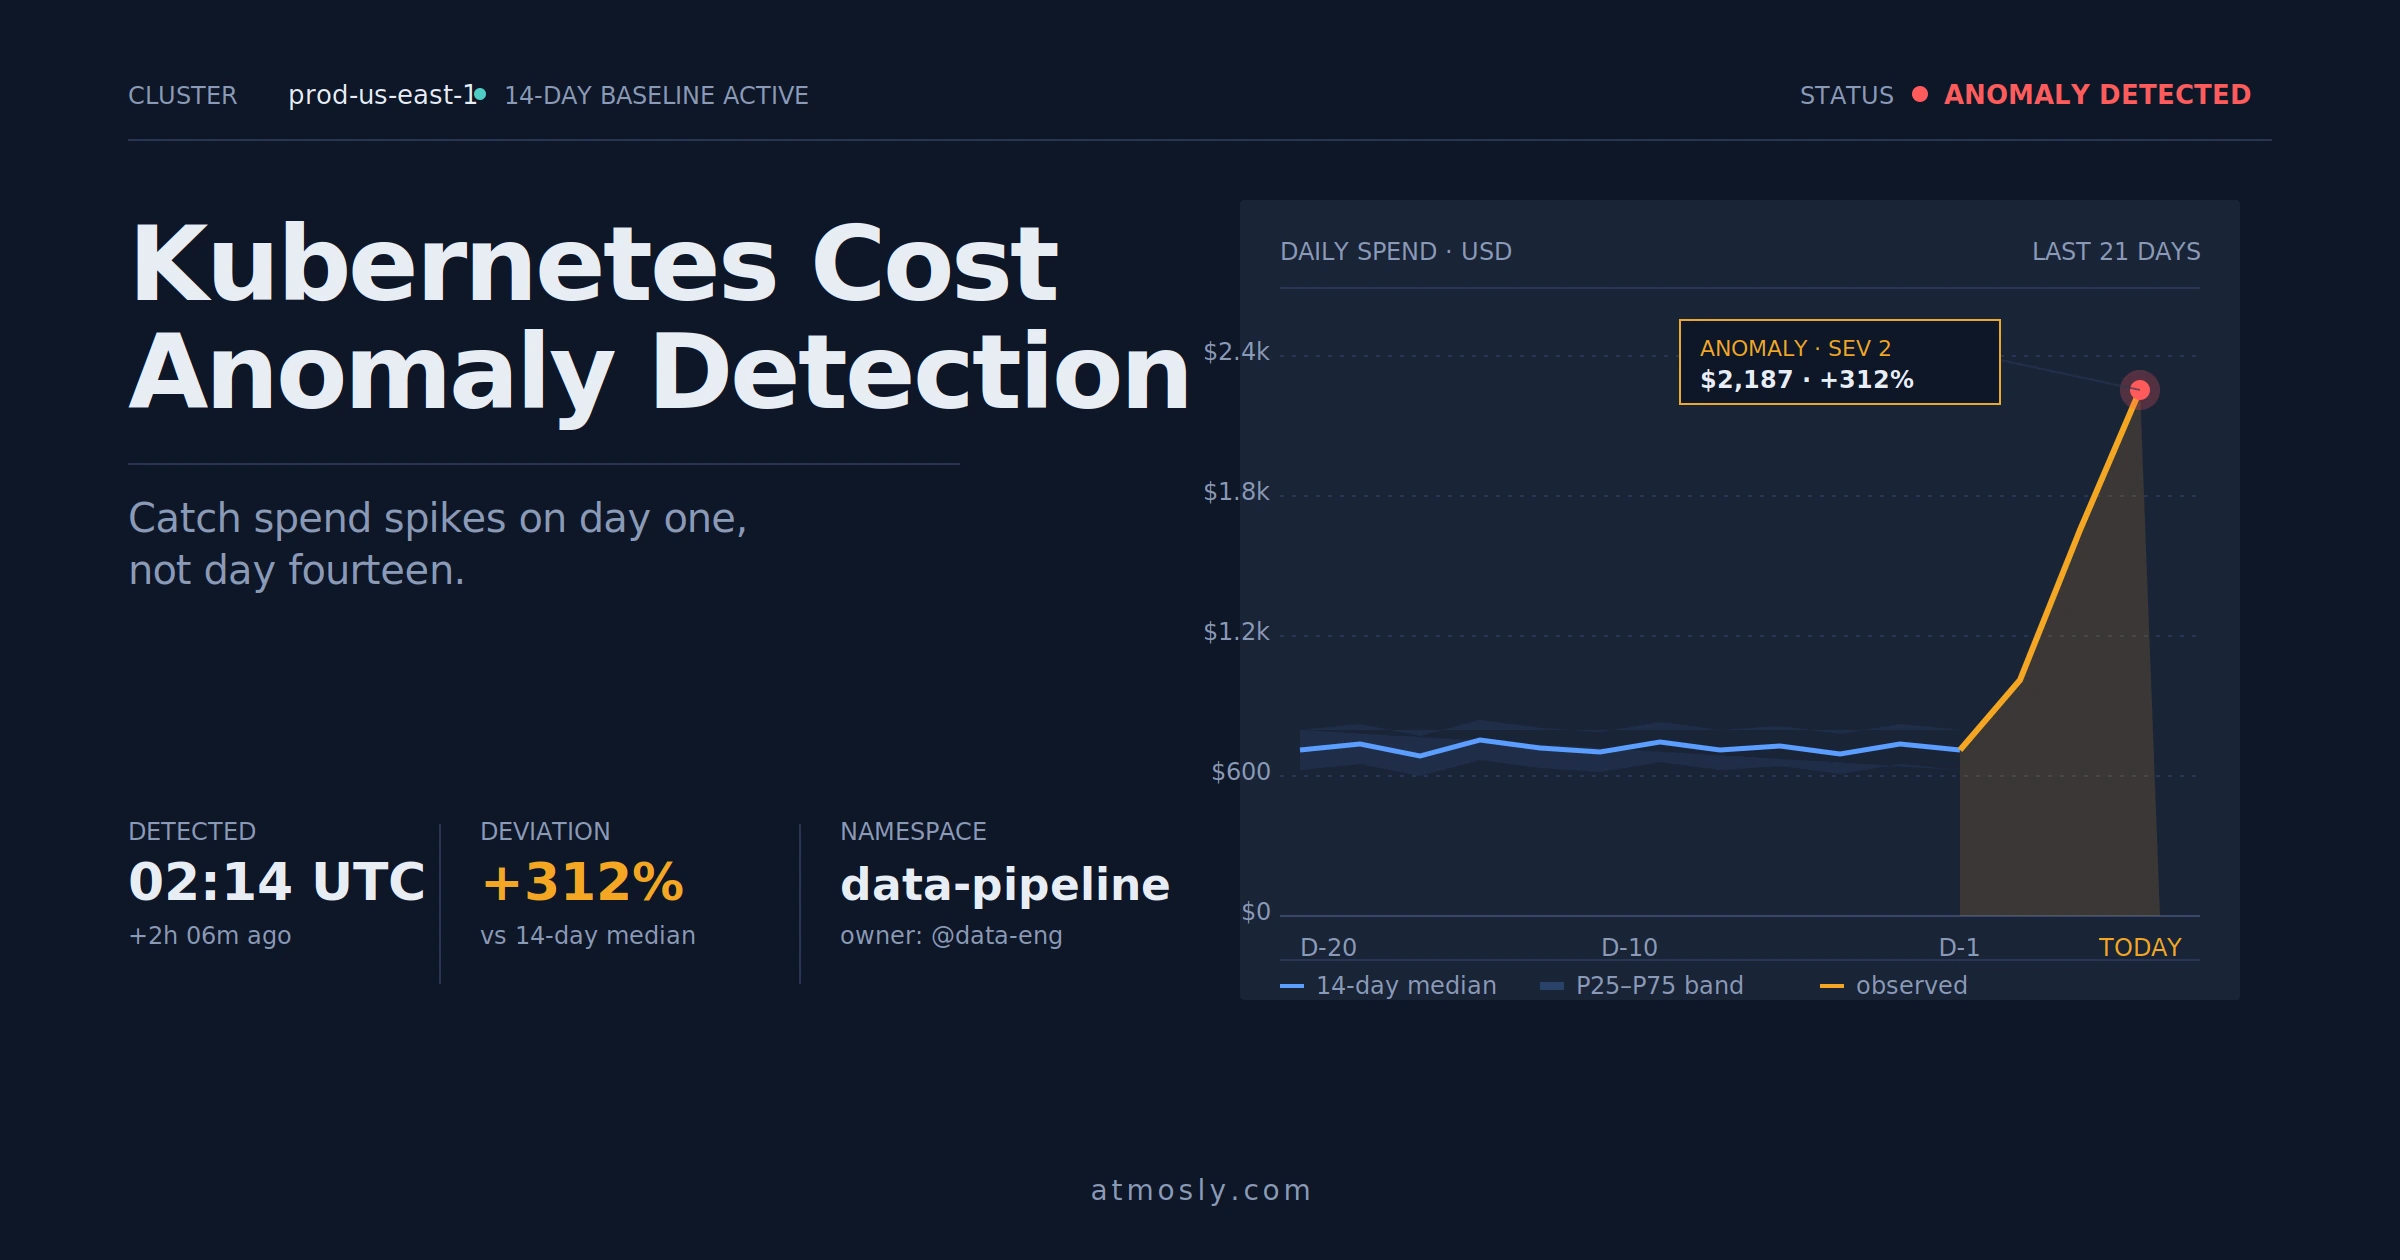
Most Kubernetes cost blowups are not gradual. They show up as a sharp two-day jump on a monthly bill nobody looks at until the finance team asks about it. By then the misconfigured autoscaler, the runaway log pipeline, or the accidentally-public egress endpoint has been quietly burning money for a week. Kubernetes cost anomaly detection is the practice of catching those events on day one — not day fourteen — by watching the shape of spend against its own baseline and alerting on deviations before they compound.
This is the layer that sits above rightsizing and cleanup. A cluster that was carefully rightsized last quarter is still one bad Helm value away from a 4× spike, and no amount of one-time optimization catches that after the fact. Anomaly detection is what protects those savings — the goal here is early signal: a Slack message on Tuesday morning, not an invoice on the first of next month.
What Is Kubernetes Cost Anomaly Detection?
Kubernetes cost anomaly detection is a monitoring discipline that continuously compares current cluster spend — broken down by namespace, workload, node group, or cost category — against an expected baseline, and raises an alert when the deviation crosses a meaningful threshold. The definition sounds simple, but the details are where teams either get useful alerts or drown in noise.
A useful anomaly signal has three properties. It is scoped — not "the cluster cost 12% more today" but "the data-pipeline namespace cost 340% more today, driven by network egress." It is actionable — the alert points at the workload, the resource type, and the time window, so an on-call engineer can start investigating without a scavenger hunt. And it is baseline-aware — a Monday-morning traffic ramp is not an anomaly, a Black Friday load surge is expected, and a batch job that runs every 14 days should not fire an alert every time it runs. Detection systems that ignore weekly and monthly seasonality generate so many false positives that teams mute the channel within a month.
Anomaly detection is not the same as budget monitoring, and the two get conflated. A budget alert fires when spend crosses an absolute threshold — "notify me when this namespace exceeds $5,000 this month." That is a lagging indicator; by the time the threshold is hit, the damage is done. Anomaly detection fires when the rate or shape of spend deviates from its own history, often days before an absolute budget would trip. Both belong in a mature setup, but they answer different questions.
Practically, this is why anomaly detection has become a core module inside every modern Kubernetes cost optimization platform — the same data pipeline that powers rightsizing recommendations is what makes real-time anomaly scoring possible in the first place. Building the pipeline once and using it for both is dramatically cheaper than running two overlapping systems.
Common Causes of Sudden Kubernetes Cost Spikes
The failure modes that produce sudden cost jumps in Kubernetes clusters are surprisingly repetitive across organizations. Five patterns account for the large majority of anomalies worth alerting on.
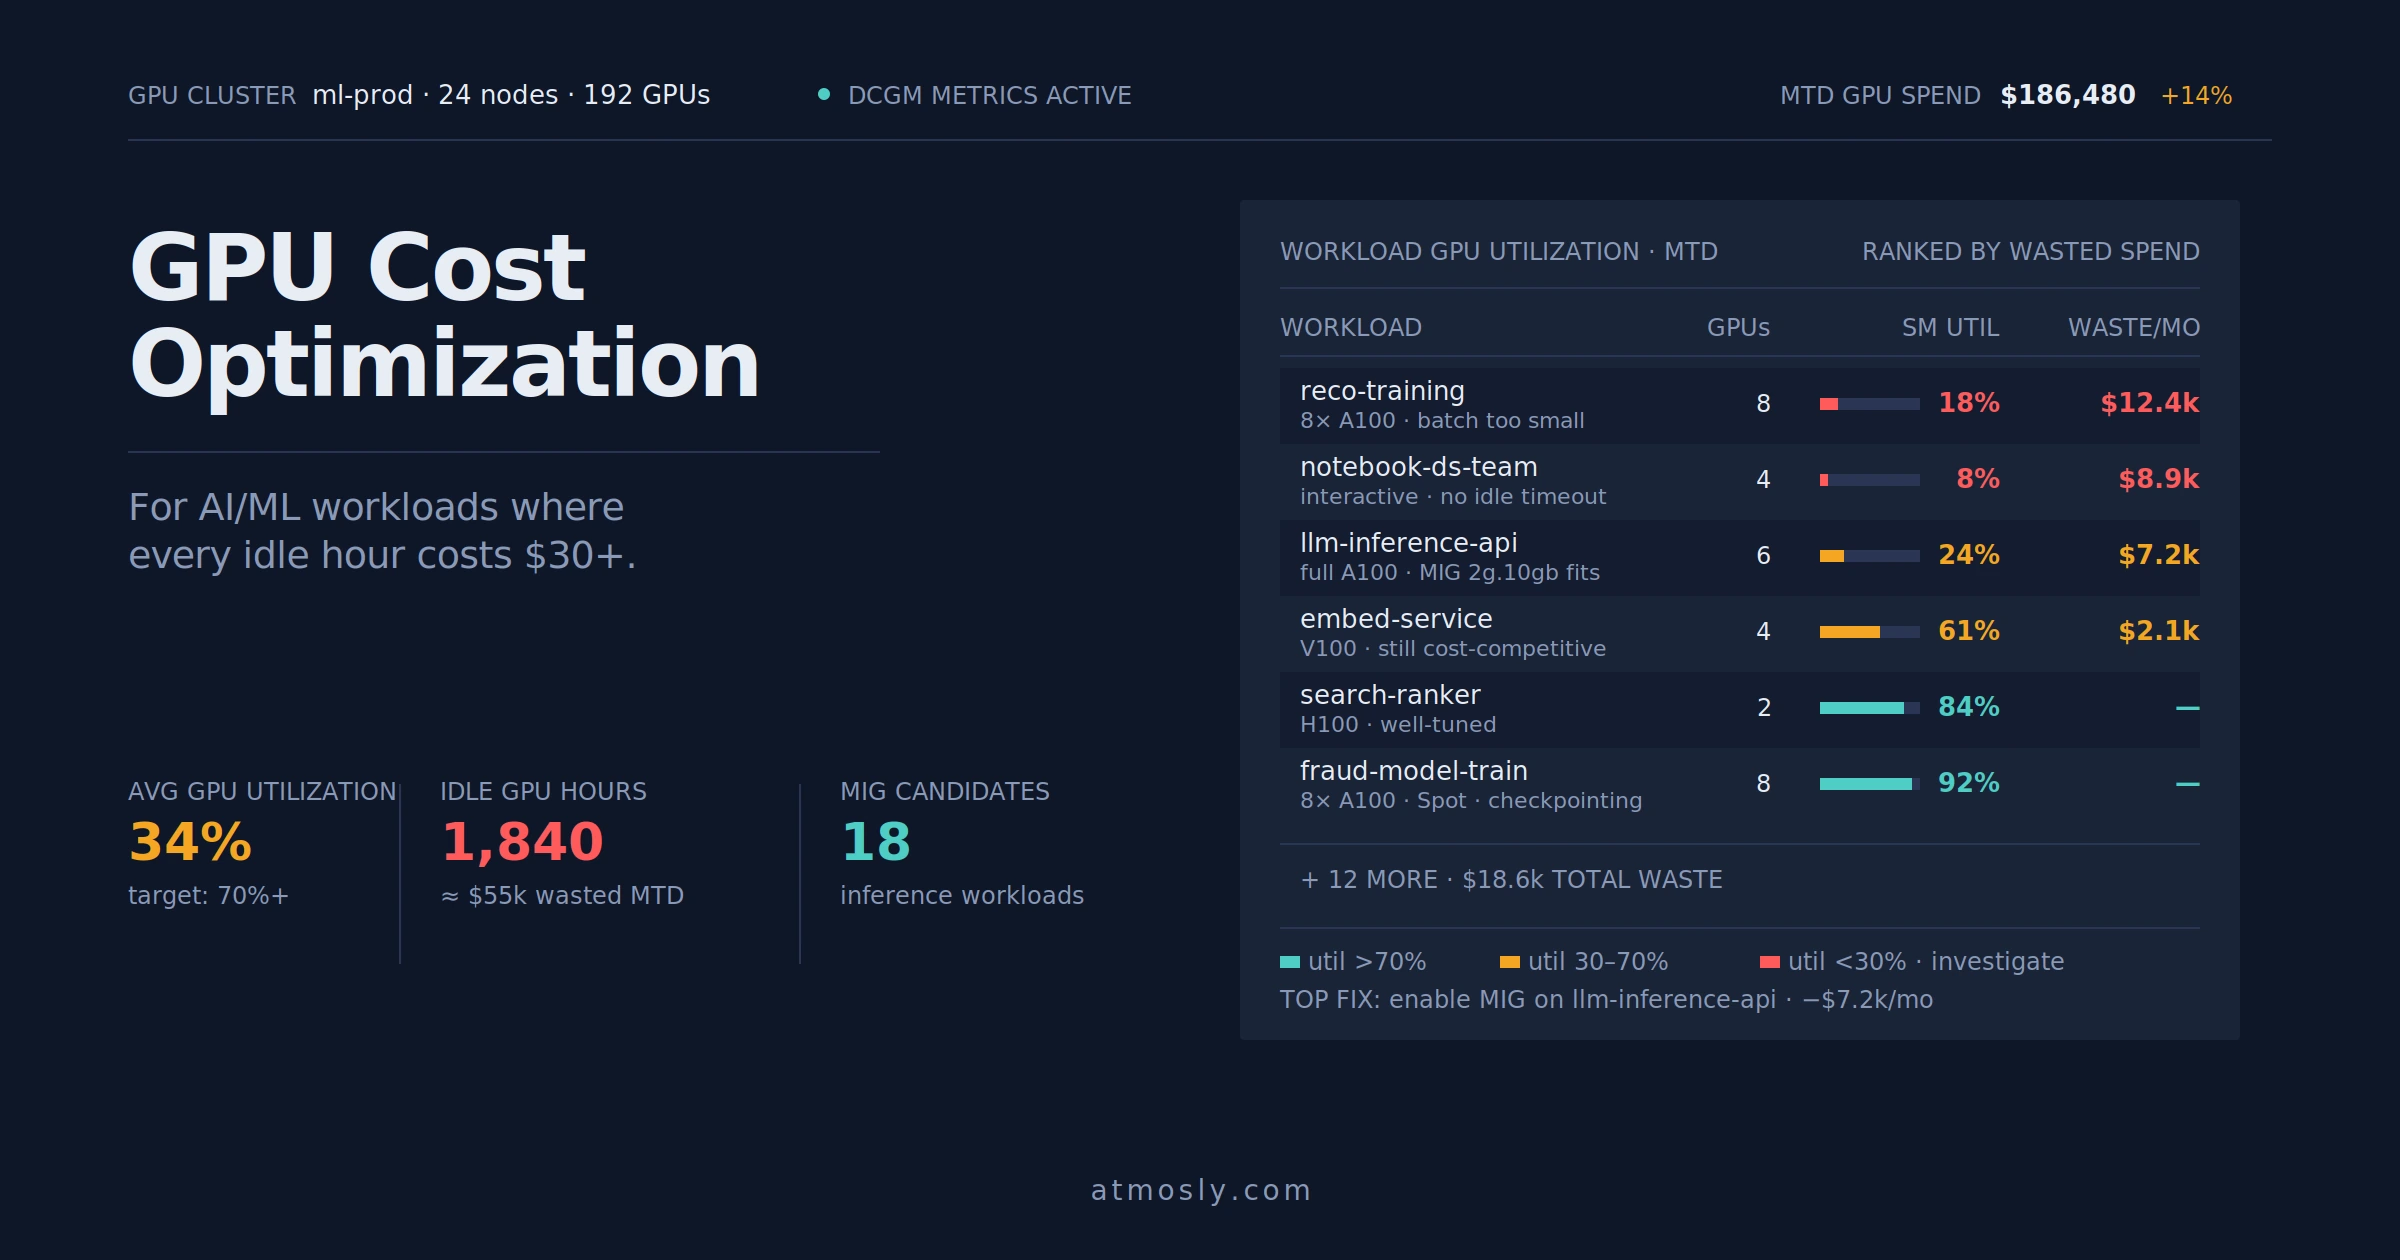
The most frequent cause is autoscaler runaway. A Horizontal Pod Autoscaler is configured against a metric that itself misbehaves — a queue depth that never drains because a downstream service is degraded, or a CPU target that gets breached because of a genuine bug rather than genuine load. The HPA does its job and scales replicas up, the Cluster Autoscaler adds nodes to accommodate them, and within a few hours the cluster is running at 3× its normal footprint doing no additional useful work. Karpenter's aggressive provisioning behaviour makes this faster, not slower, so teams running Karpenter without spend guardrails see the sharpest spikes.
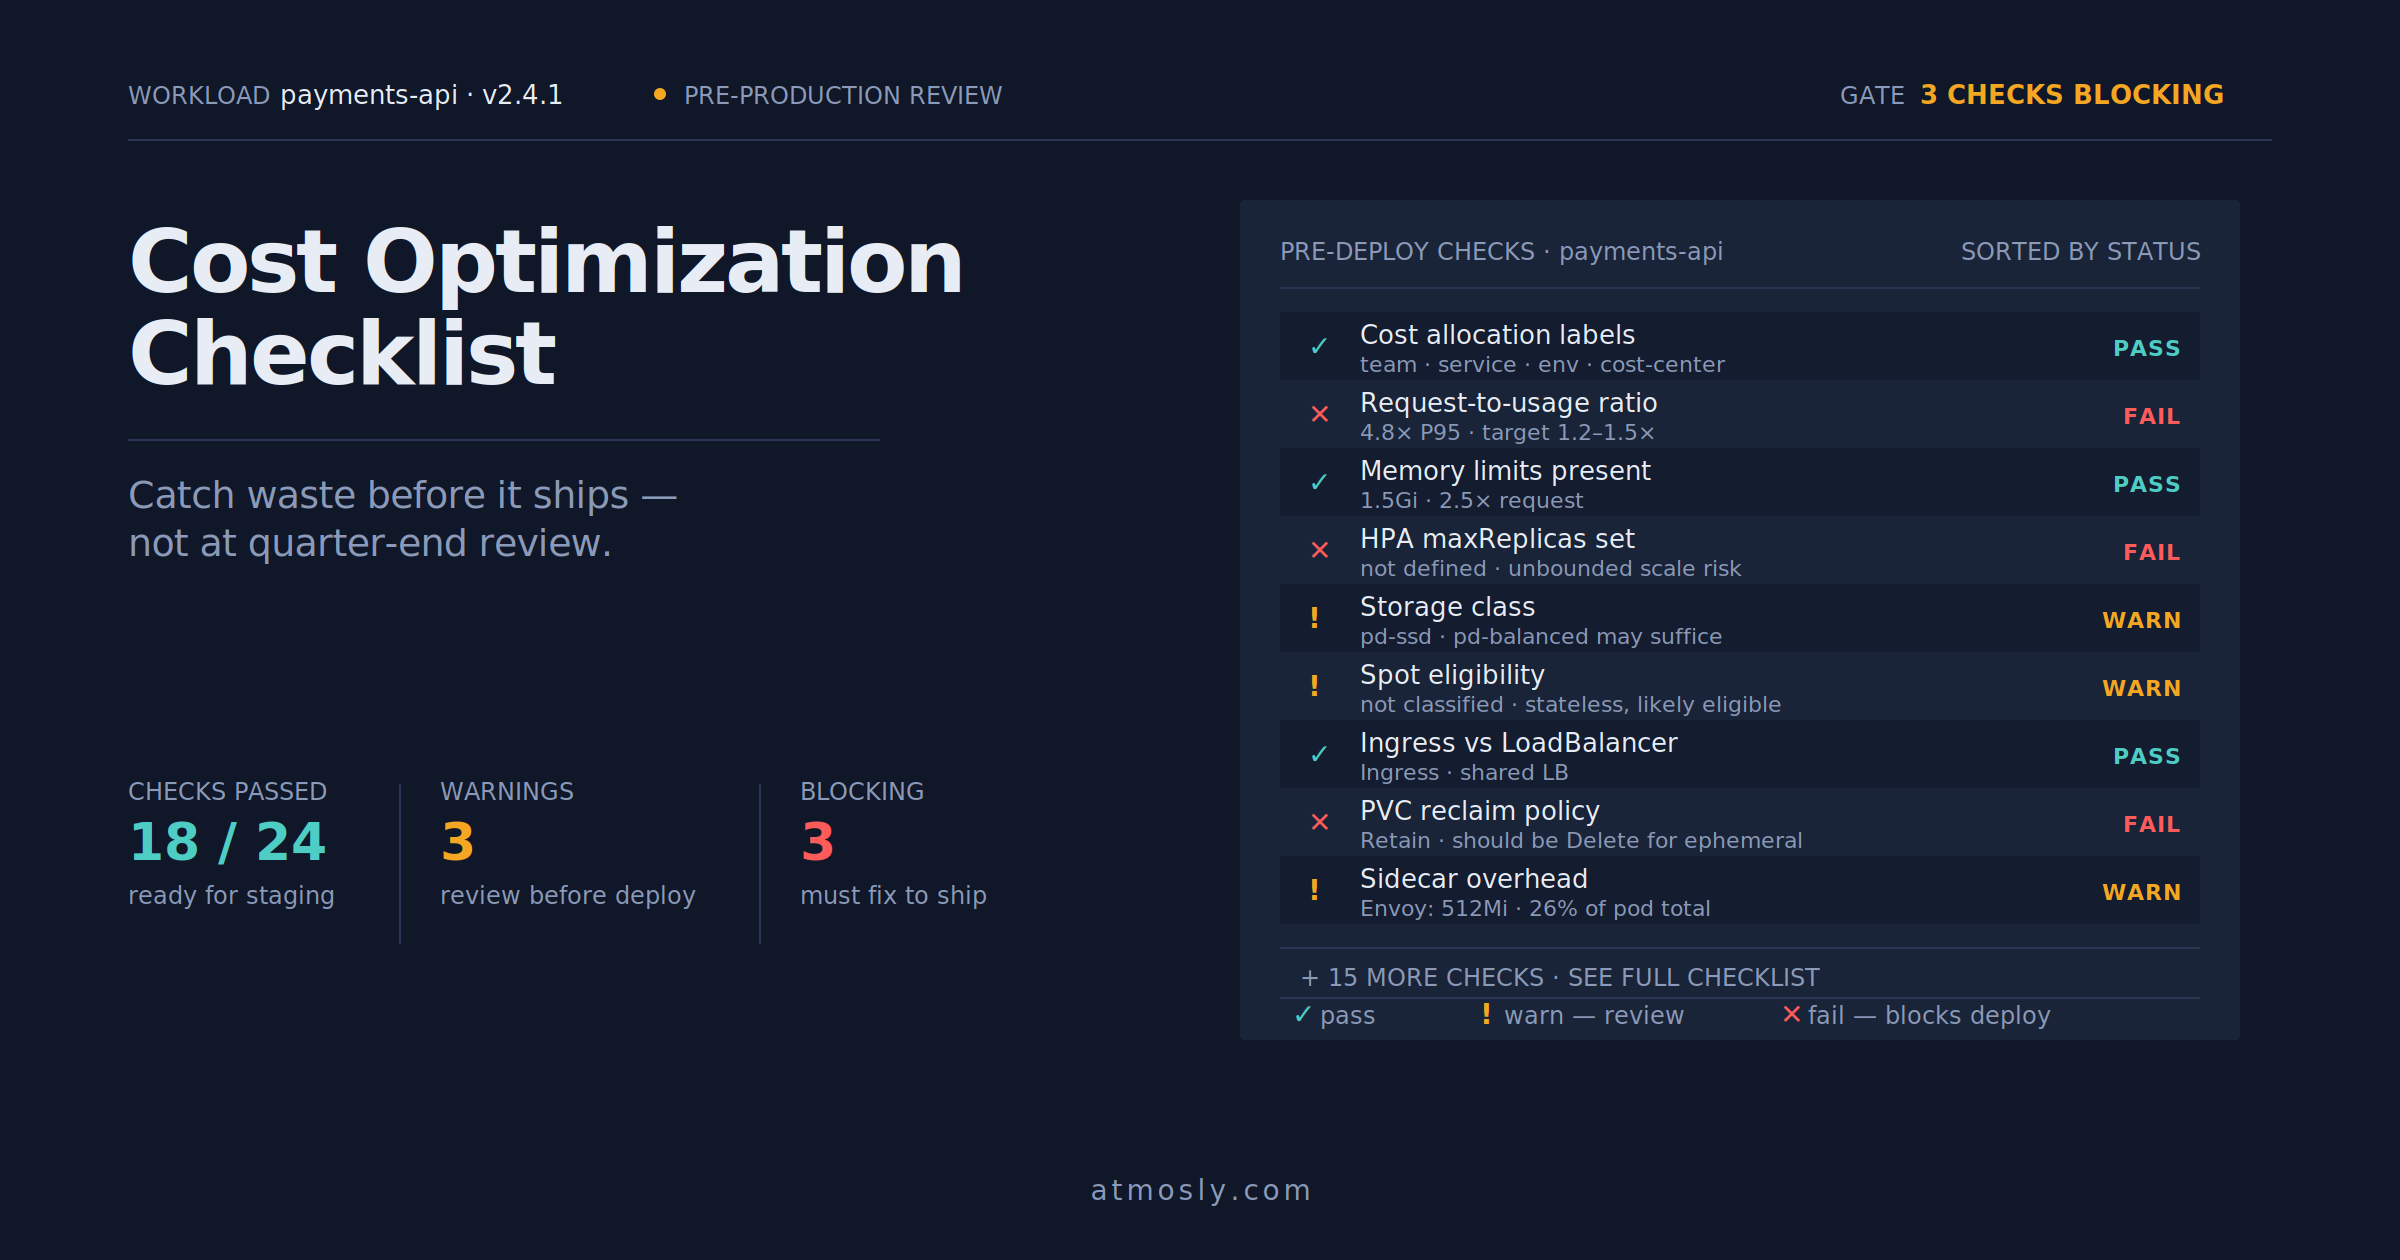
The second is misconfigured resource requests on a new deployment. A copy-pasted Helm chart lands in production with requests.memory: 32Gi where the workload needs 2Gi. The pod schedules, appears healthy, and quietly holds a large chunk of a node hostage until someone notices the cluster running out of schedulable capacity and adds nodes to compensate. Because the pod itself looks fine, this rarely fires an application alert — the cost anomaly is often the first signal.
Third is observability data explosion. Log or metric volume from a single workload jumps by an order of magnitude — often after a debug flag was enabled and never turned off, or after a loop started writing exception traces every millisecond. Datadog, New Relic, Splunk, or a self-hosted Loki cluster bill by ingest volume, so the spike shows up not in the Kubernetes bill directly but in the observability line item, which is usually orders of magnitude more expensive per GB than object storage.
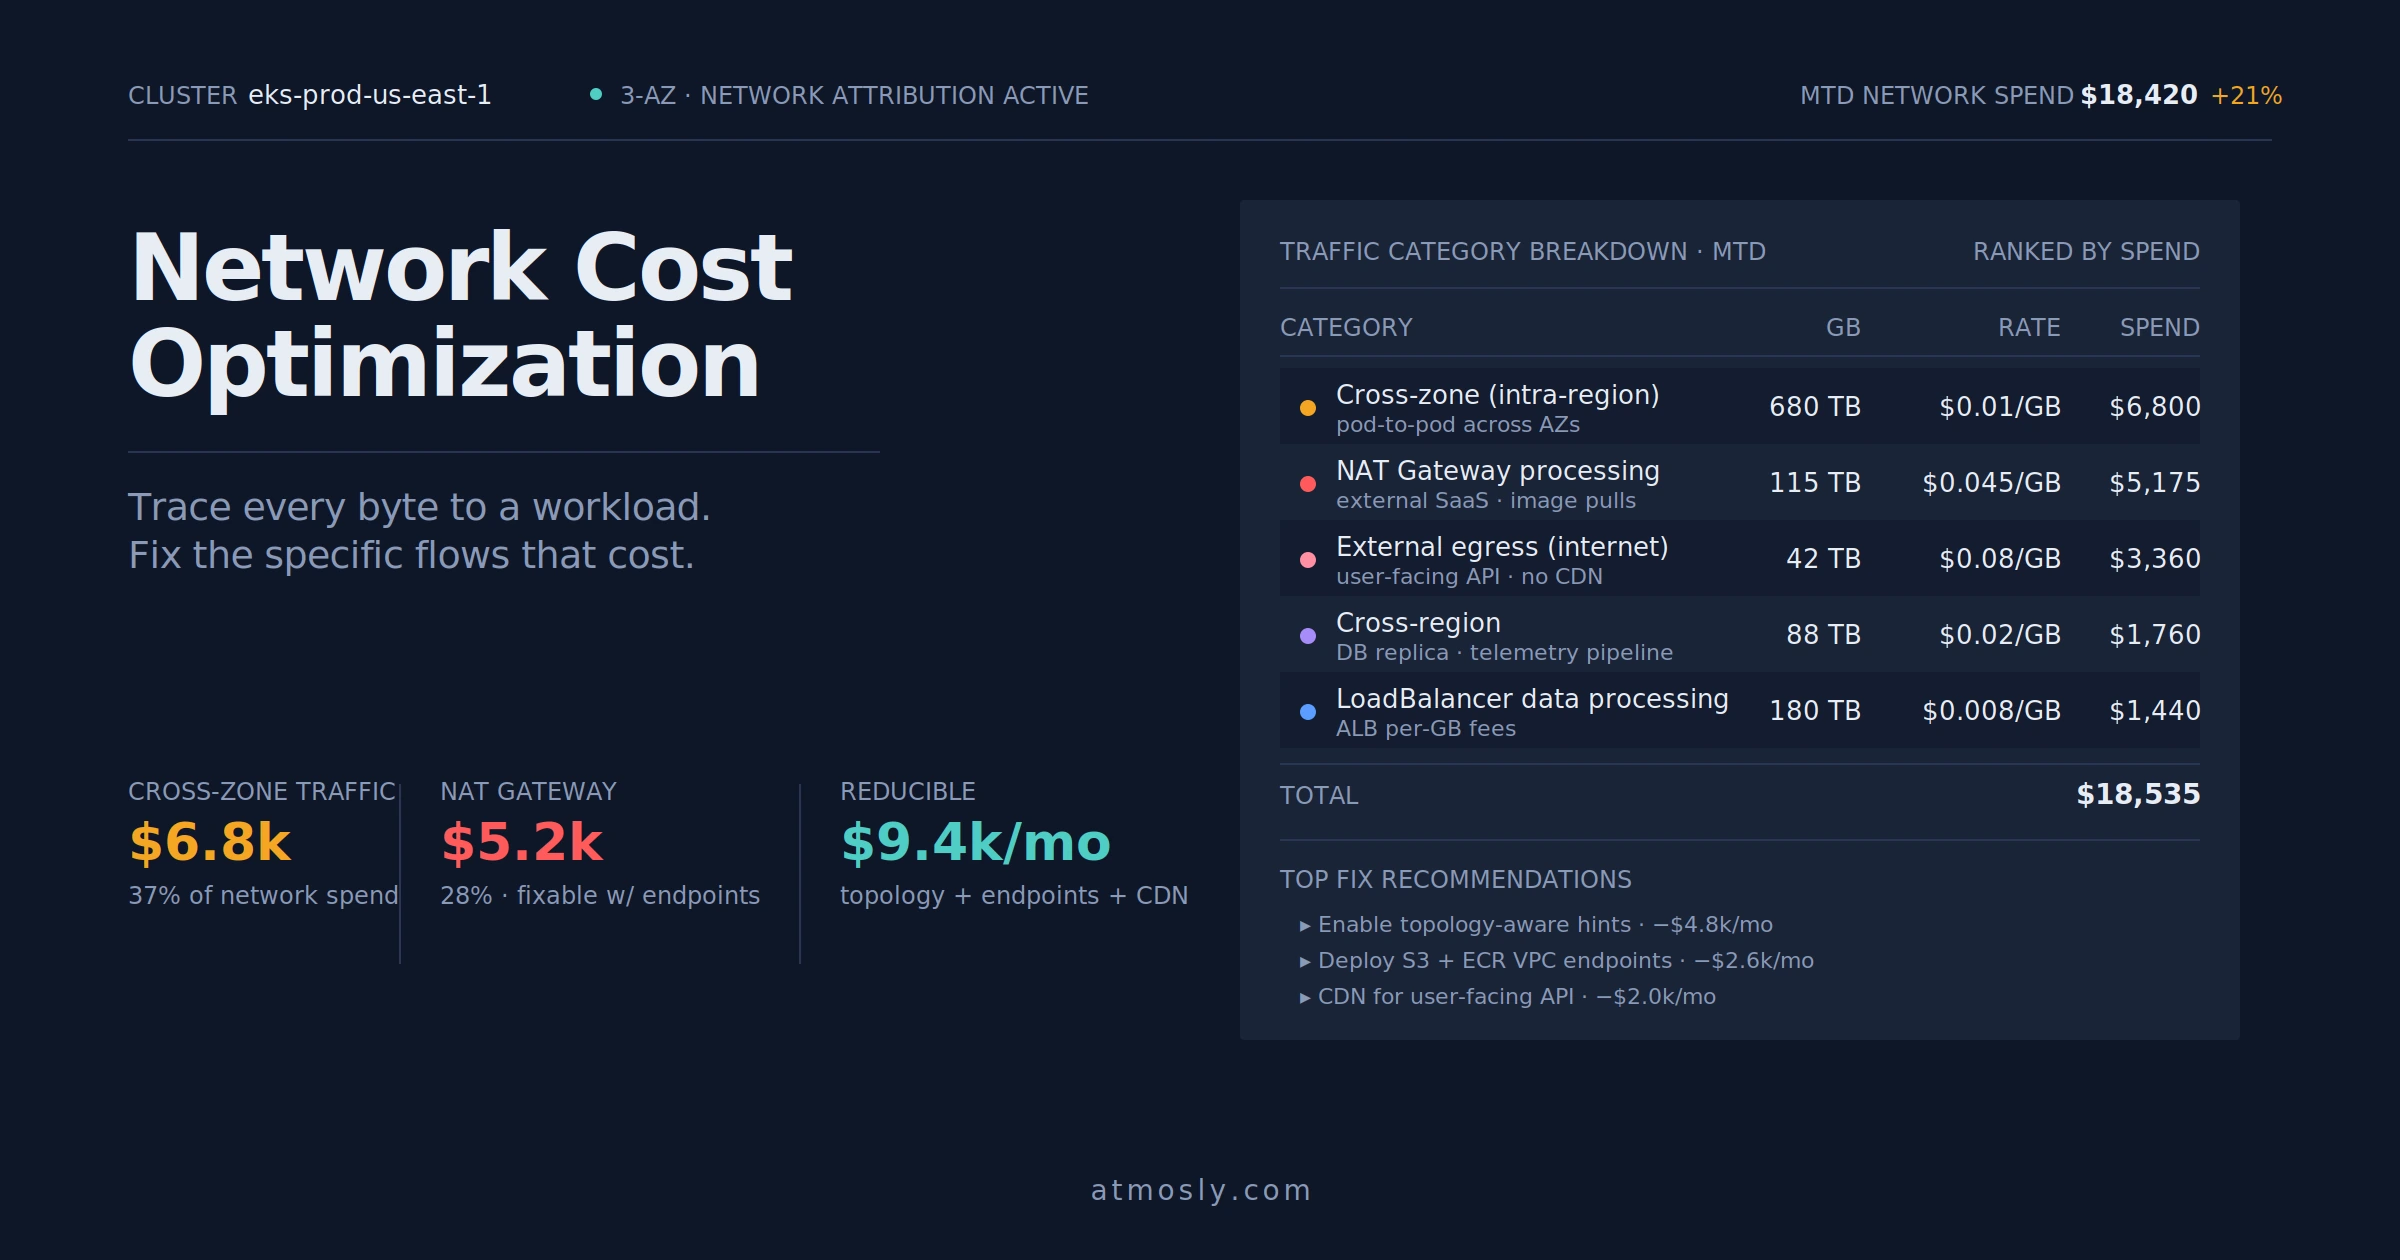
Fourth is cross-AZ or cross-region data egress. A schema migration, a new service mesh configuration, or a poorly-placed replica causes traffic that previously stayed within an availability zone to start crossing zones or leaving the region. In AWS this is $0.01–$0.02 per GB for cross-AZ and $0.02 per GB for cross-region — trivial per request, ruinous at scale, and completely invisible to most Kubernetes-native cost tools that only look at compute.
Fifth is orphaned or forgotten resources at scale. Not the routine orphaned PVC that everyone knows about, but a CI/CD pipeline that started creating ephemeral namespaces and stopped tearing them down after a bug in the cleanup job. The cost curve looks like a staircase — same additional daily spend added every night — which is a distinctive signature once you know to look for it.
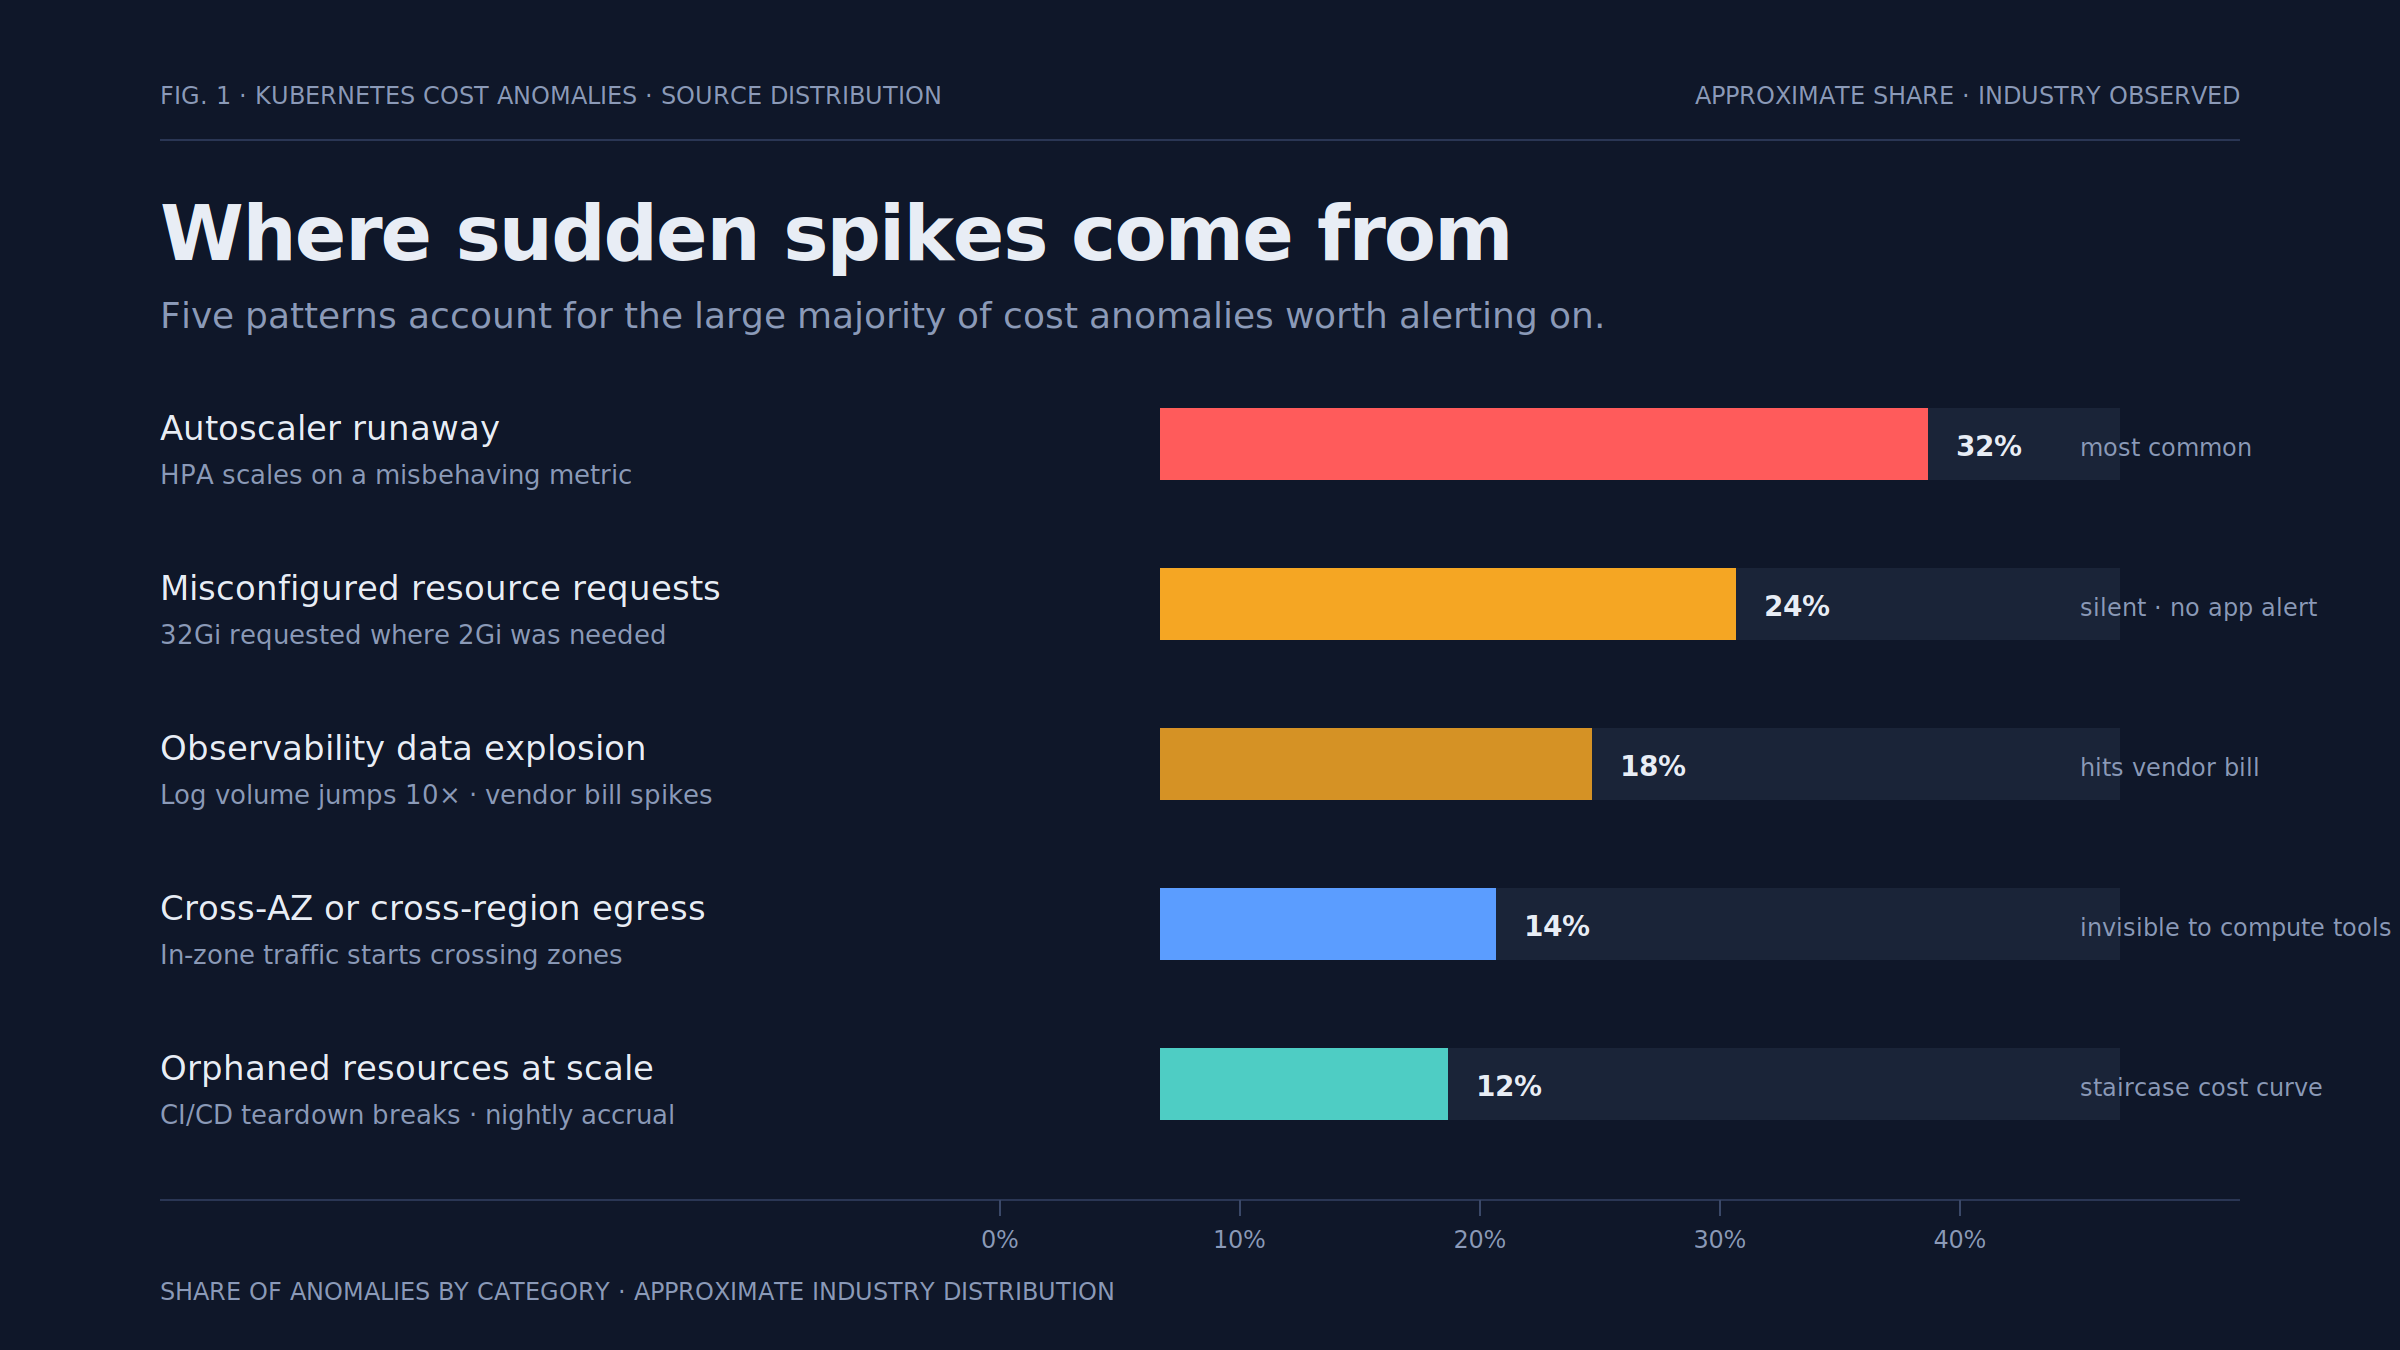
These five cover the majority of what a well-tuned anomaly detector will surface. The pattern that matters is that none of them are visible on kubectl top — they show up either in the cloud bill directly or in derived metrics like ingress bytes, node count, and log ingestion rate.
Catching them consistently is where a dedicated Kubernetes cost optimization platform pays back the investment, because each of these categories needs a different data source stitched into the same alerting pipeline — compute from the cloud bill, network from flow logs or service mesh telemetry, observability from vendor usage APIs. Doing that join in-house is possible; keeping it working through vendor API changes and cloud billing schema updates is the part that quietly consumes engineering time.
The relationship between these anomalies and the steady-state waste from over-requested resources matters too. If you have not yet addressed baseline overprovisioning, we covered that groundwork in detail in our guide to Kubernetes idle resources and hidden cloud waste, and anomaly detection on top of an untuned cluster tends to fire constantly on noise from the baseline itself.
How to Detect Kubernetes Cost Anomalies Early
Detection needs three ingredients: a data source with enough granularity, a baseline model that respects seasonality, and an alert routing path that ends at a human who can act.
The data source has to combine cloud billing with Kubernetes-side attribution. Raw AWS Cost Explorer or GCP Billing Export tells you the cluster spent more today, but not which namespace or workload caused it. To get from "the cluster" to "the payments-api deployment," you need to join billing data with kube-state-metrics, node labels, and pod-level resource attribution — the same joins that drive per-namespace cost allocation. If you have not built that pipeline yet, the alternative is billing-tag-based detection, where every workload writes cost allocation tags that flow through to the bill. That works but has a 24–48 hour lag, which erodes the "early" in early detection.
The baseline model is where naive setups fail. A flat threshold — "alert if daily spend exceeds 120% of yesterday" — generates false positives every Monday morning and every deployment day. A rolling average over 7 days handles weekly seasonality. A model that also accounts for month-of-quarter effects and known deployment windows handles most of the rest. In practice, most teams get 80% of the value from a simple approach: for each namespace and each cost category (compute, storage, network, observability), compare today's spend against the 14-day trailing median, and alert on deviations greater than 2 standard deviations or 50% absolute, whichever is larger. The absolute floor prevents pager fatigue from small workloads whose 300% spike still costs $12.
Alert routing is the piece that most implementations get wrong by making alerts too general. An anomaly Slack channel that receives twelve alerts a day gets muted; an anomaly alert that pages the wrong on-call rotation gets ignored. The routing should follow ownership — namespace-labelled alerts go to the team that owns the namespace, node-group-level anomalies go to the platform team, and observability-bill anomalies go to whoever owns the observability stack. This is the same ownership problem that appears in Kubernetes cost allocation via showback and chargeback, because anomaly detection is essentially real-time cost allocation with a threshold.
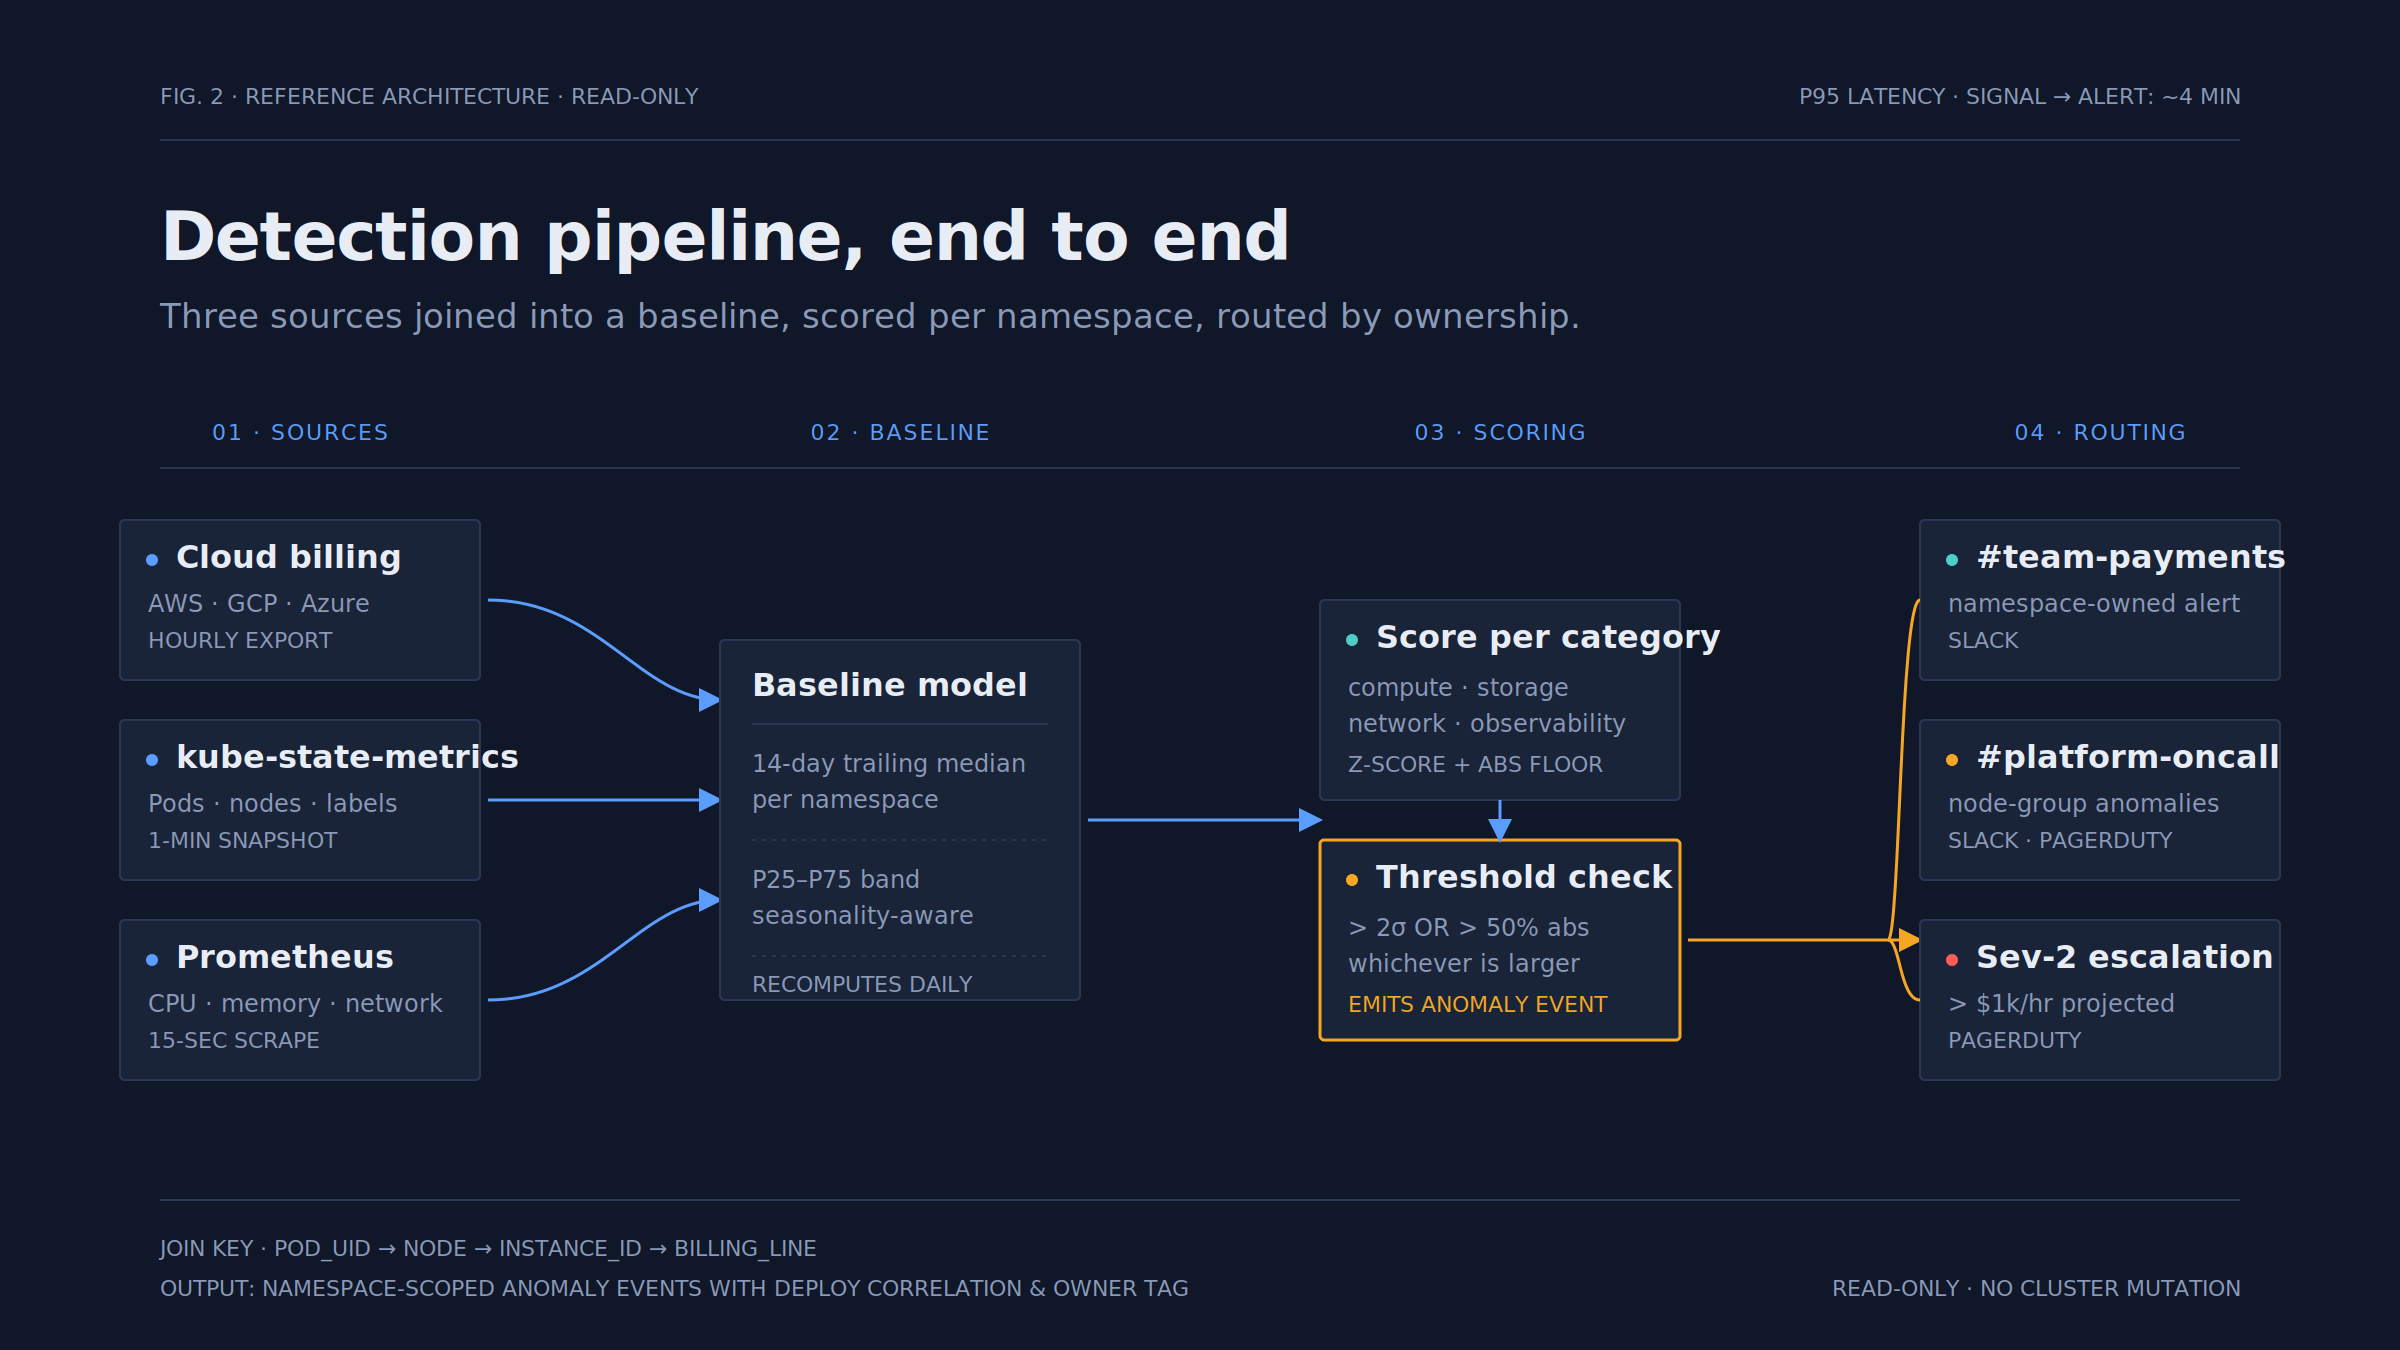
For teams building this from scratch, a minimal working setup looks like: cloud billing exported to a data warehouse hourly, joined against a kube-state-metrics snapshot at the same cadence, feeding a scheduled query that computes namespace-level anomaly scores, with results posted to Slack via a webhook. That is a week of work for a competent data engineer and produces useful alerts on day one. The version most teams eventually want — with per-workload attribution, seasonality-aware baselines, deployment correlation, and automatic runbook links — takes longer, which is where a dedicated Kubernetes cost optimization platform starts to earn its keep by shipping those layers out of the box rather than as quarters of internal engineering work.
If you are still in the tool-evaluation stage, our comparison of the best Kubernetes cost optimization tools covers the anomaly-detection capabilities of each option alongside their rightsizing and reporting features.
How to Investigate the Root Cause of Cost Spikes
Getting a clean alert is half the problem. The other half is going from "the analytics namespace cost 4× more yesterday" to a specific commit, config change, or workload behaviour that explains it — quickly enough that the fix ships before the same spike repeats today.
A useful investigation follows a rough order. Start with the what — which resource category actually spiked. A namespace running 4× more expensive because compute doubled is a different problem from the same namespace running 4× more expensive because egress went up 40×. The cost breakdown tells you which subsystem to look at, and each subsystem has its own diagnostic path.
For compute spikes, the questions are: did node count increase, did per-node instance type change, or did existing nodes get more expensive due to spot interruption forcing on-demand fallback? kubectl get nodes history — if you retain it — answers the first. Cluster Autoscaler and Karpenter logs answer the second. Spot interruption events from the cloud provider answer the third. The most common finding is a runaway HPA on a specific workload, which is quickly confirmed by looking at replica count history for the deployments in the affected namespace.
For network spikes, look at pod-to-pod traffic patterns and cross-AZ flows. If you have a service mesh, its telemetry is the fastest source. If not, VPC flow logs will get you there but with more effort. The pattern that almost always causes real damage is a workload that started talking to a database or cache replica in a different AZ than itself — often after a routine rebalance or failover — and the traffic never rerouted back.
For storage spikes, the culprits are usually snapshot proliferation (a backup job that started retaining more history than intended), sudden PVC growth from a workload logging to disk instead of stdout, or object storage overwrites that lost lifecycle policies. kubectl get pvc with size deltas over time is the starting point; the cloud provider's storage inventory tools handle the object-storage side.
For observability spikes, the fastest diagnostic is your logging or metrics vendor's own usage dashboard — most break down ingest by source or tag. The change that caused the spike is almost always a recent deploy, so correlating the spike timestamp with the deployment history of workloads in the affected namespace narrows it down within minutes.
Across all of these, the meta-skill is correlation with deployments. Roughly 70% of cost anomalies worth alerting on trace back to a change that landed in the previous 24–48 hours. An anomaly alert that automatically surfaces recent deploys, Helm chart changes, and config map updates in the affected namespace is dramatically more useful than one that only names the namespace and the delta.
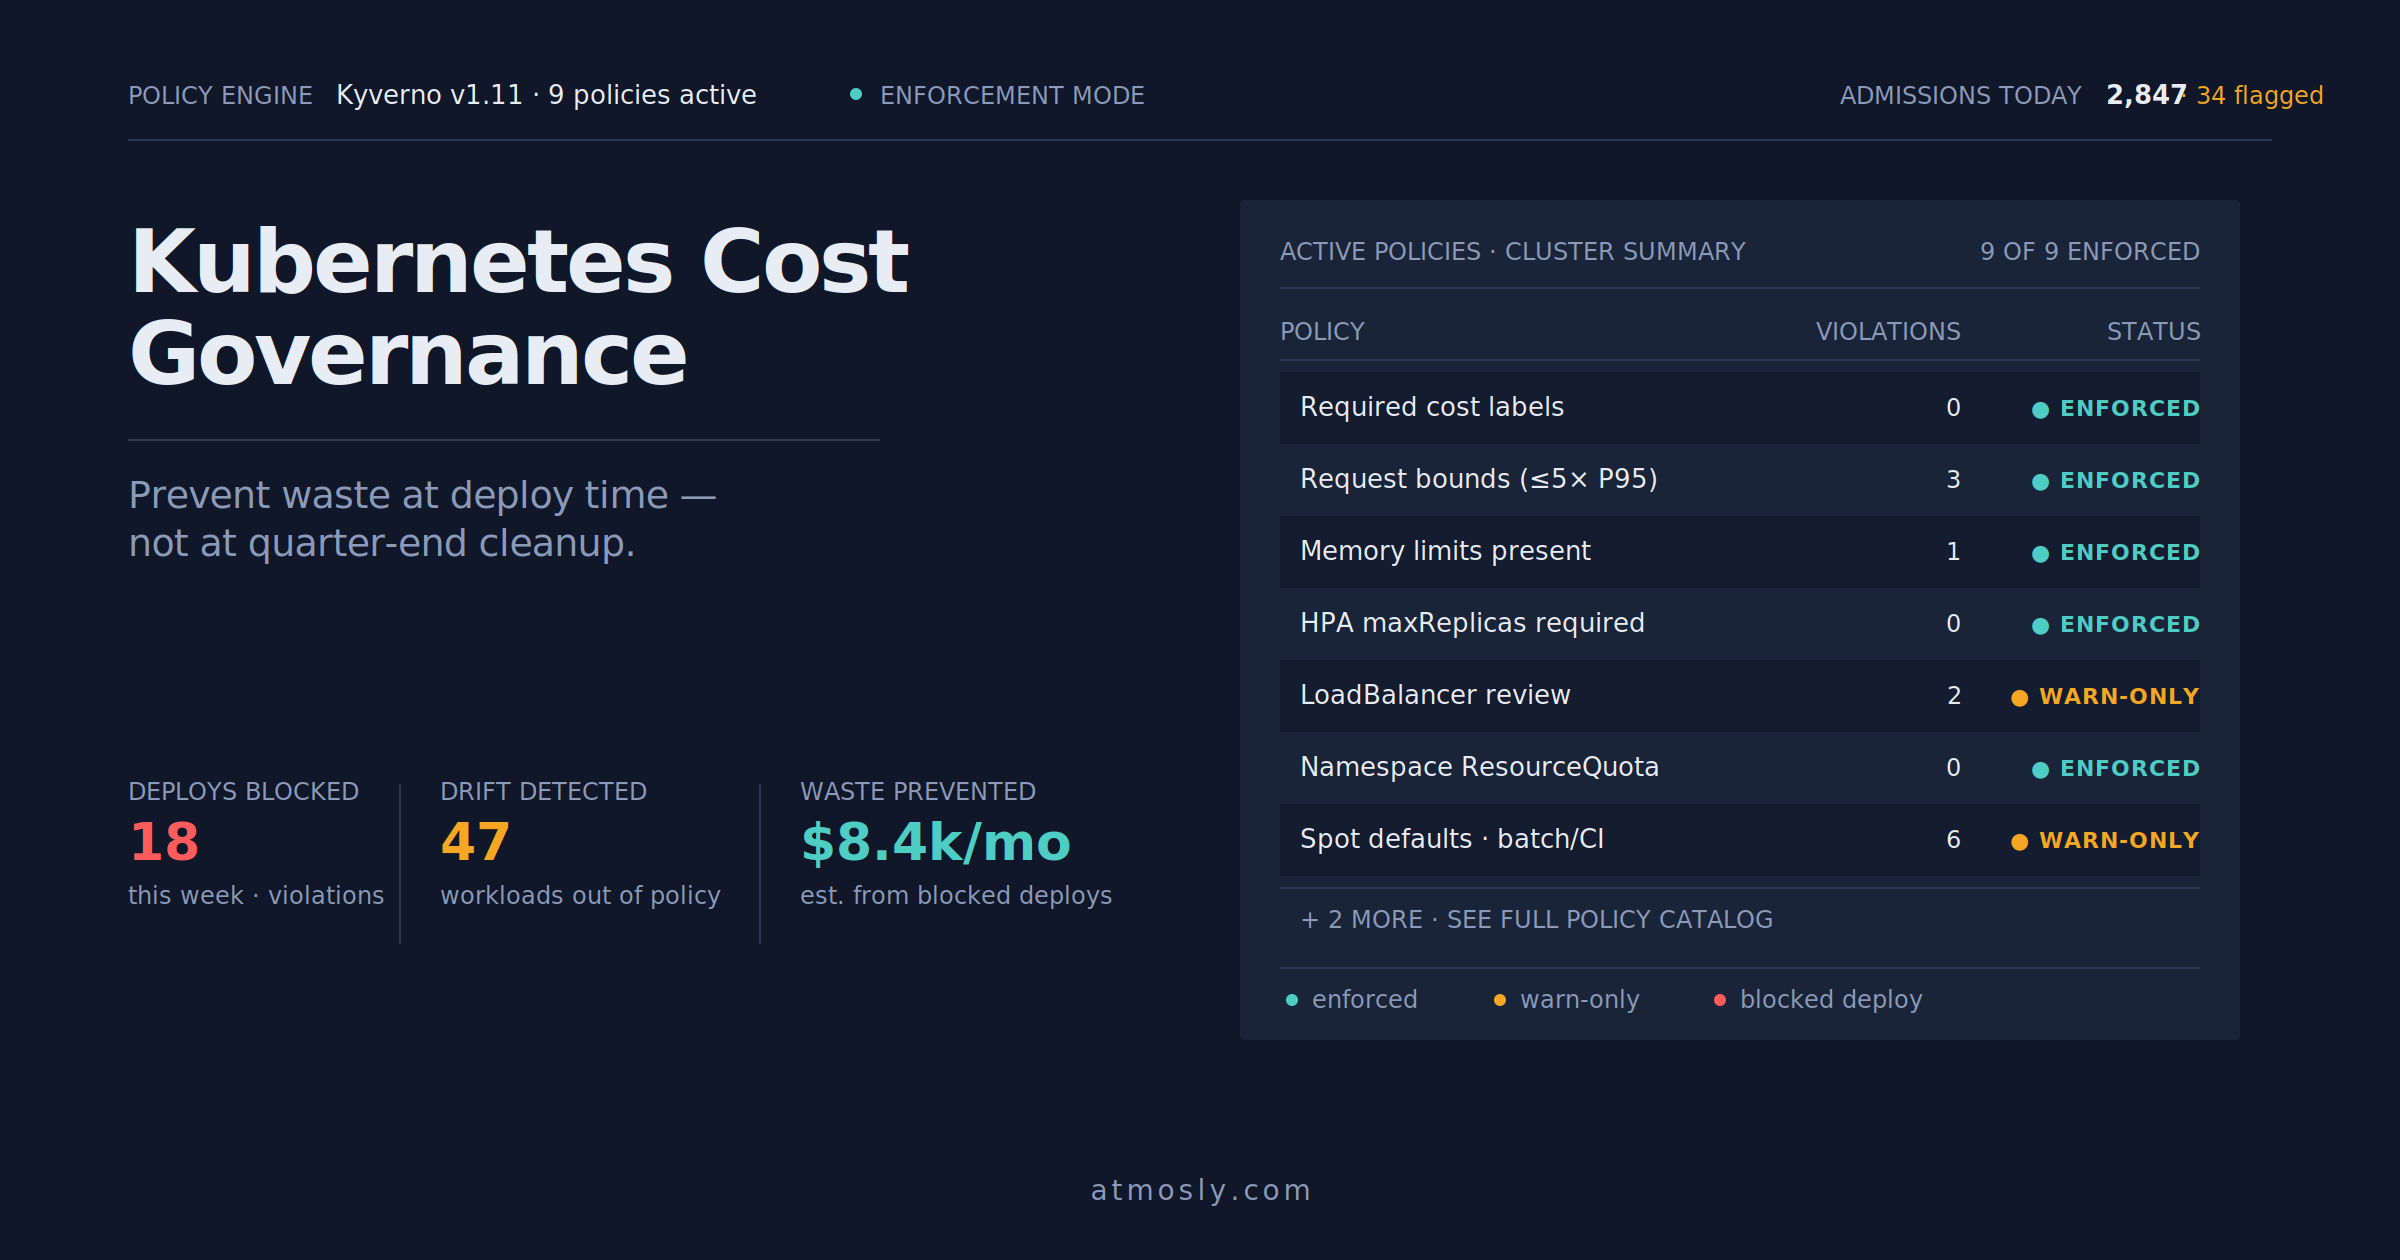
Post-investigation, the fix pattern is the same regardless of category: revert or roll forward, add a guardrail so the same class of issue does not recur, and update the runbook. The guardrail step is what turns a one-off firefight into a pattern that stops repeating — a Kyverno policy that rejects deployments requesting more than N× the namespace's historical usage, a Karpenter provisioner limit that caps total node count, or a log-volume alert on the observability side that fires before the bill does.
For the deeper mechanics of avoiding the reliability regressions that badly-executed cost work tends to cause, our writeup on right-sizing Kubernetes workloads with a data-driven approach covers the P95-based methodology that most guardrails should be built on.
What Good Looks Like
Teams that run anomaly detection well share a few characteristics. Their alert channel is quiet most days and precise when it fires — a small number of alerts per week, each naming a specific namespace and category, each closed within a few hours. Their baselines are recomputed continuously rather than set once and forgotten, so a workload that legitimately grew last month raises its own bar rather than firing constantly. And their alerts are wired into the same escalation paths as any other production signal, so anomalies get handled with the same seriousness as latency or error-rate incidents.
The teams that struggle usually have one of three problems: alerts too noisy to trust, alerts that arrive too late to matter, or alerts that name a cluster or a cost total but not an owner. The first two are technical problems fixable with better baselines and lower-latency data sources. The third is an organizational problem — cost anomalies without owners get triaged by nobody, exactly like every other unowned signal.
See your cluster's anomaly profile in an afternoon.
Connect a cluster read-only to Atmosly's Kubernetes cost optimization platform and get a 14-day baseline plus current-day anomaly scores per namespace within minutes. No write access, nothing changes in your cluster. Try Atmosly free →
Related Articles
- Kubernetes Idle Resources: How to Find and Remove Hidden Cloud Waste — the baseline waste categories that anomaly detection sits on top of.
- Right-Sizing Kubernetes Workloads: A Data-Driven Approach — the P95 methodology that most anomaly-detection guardrails should be built on.
- Kubernetes Cost Allocation: Showback vs Chargeback — the ownership model that turns anomaly alerts into action.