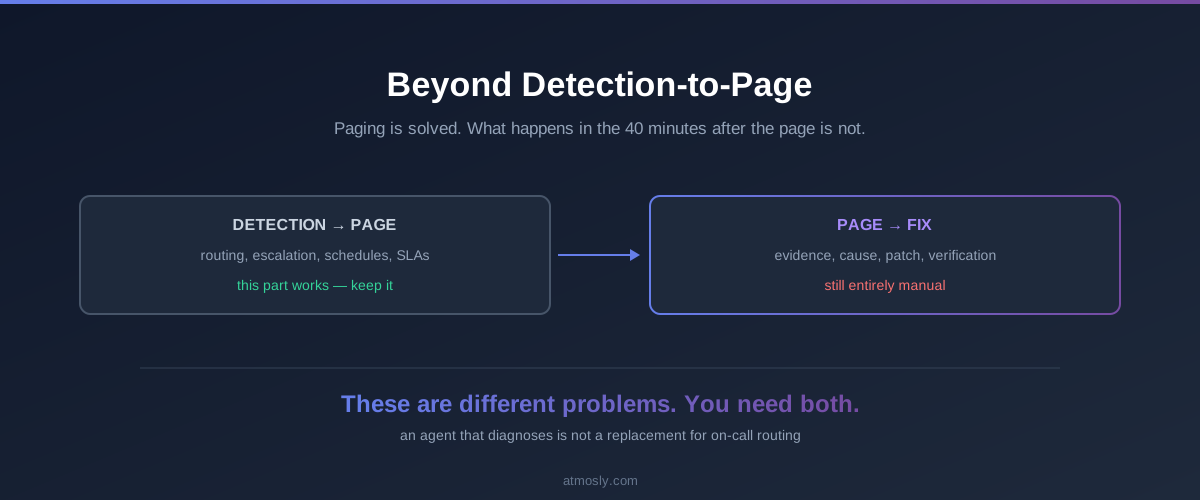
PagerDuty is very good at the problem it solves: getting the right human awake, fast, with escalation if they do not respond. That problem is solved, and nothing in this article suggests replacing it.
The gap is what happens after the page. Routing an alert takes a few minutes. Working out which container died, why, what the right fix is, applying it, and confirming it held takes most of an hour. No paging tool addresses that stretch, because it was never designed to — and for Kubernetes specifically, that stretch is where nearly all the incident time lives.
This covers what belongs in each layer, what changes when diagnosis arrives with the page, and the honest state of the integrations.
What a paging tool is actually for
PagerDuty, Opsgenie and their peers answer a specific set of questions well:
- Who is on call for this service right now?
- Did they acknowledge, and if not, who is next in the escalation policy?
- How do we suppress this during a maintenance window?
- What is our acknowledgement time against the SLA we promised?
Those are scheduling and routing problems. They are largely independent of what the alert says — the same escalation policy works whether the payload is a Kubernetes OOMKill or a payment gateway timeout. That generality is the strength, and it is also the reason a pager tool cannot tell you why your pod died.
Where the time actually goes
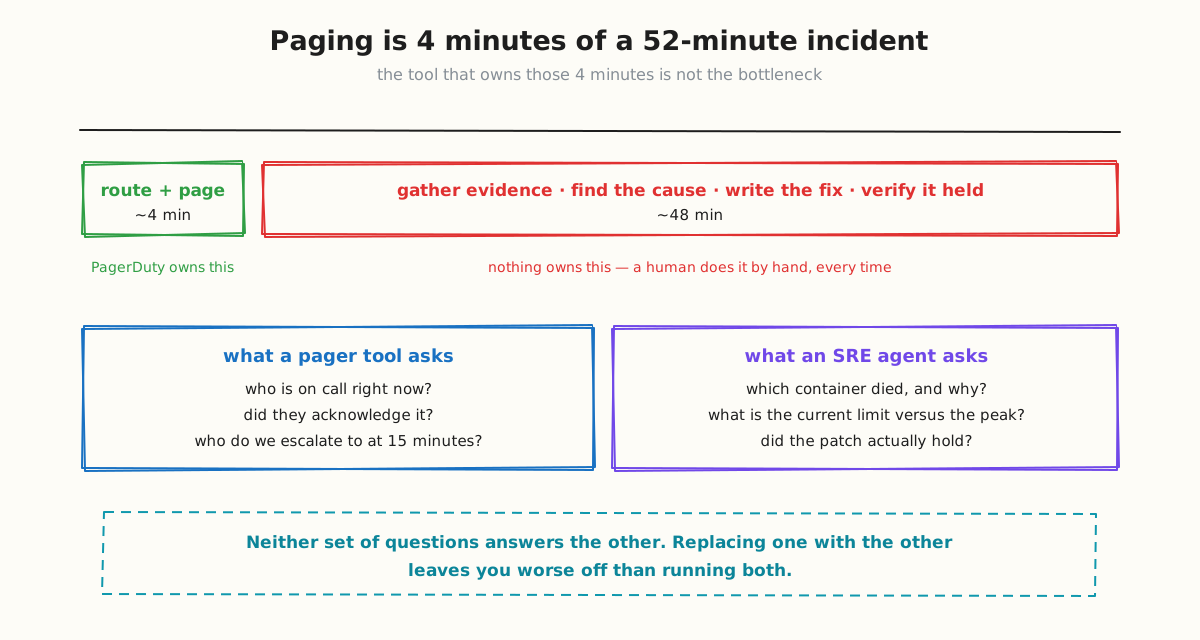
Take a routine crash loop. Alert fires at 02:04, on-call acknowledges at 02:09, root cause identified at 02:23, fix merged at 02:38, verified stable at 02:51.
See what your next page could arrive with.
Connect a cluster read-only in about 5 minutes and get the live issue list with causes already attached. No write access, nothing changes.
Routing consumed five minutes of a forty-seven minute incident. Everything else was a human reading logs, checking recent deploys, comparing the current memory limit against actual usage, and deciding what number to put in the patch.
Optimising the five minutes has a small ceiling. Even instantaneous paging saves four minutes on an incident where forty-two were spent elsewhere. This is the arithmetic behind the whole argument — and it is also why "we already have PagerDuty" is not an answer to "how do you shorten incidents."
What changes when diagnosis arrives with the page
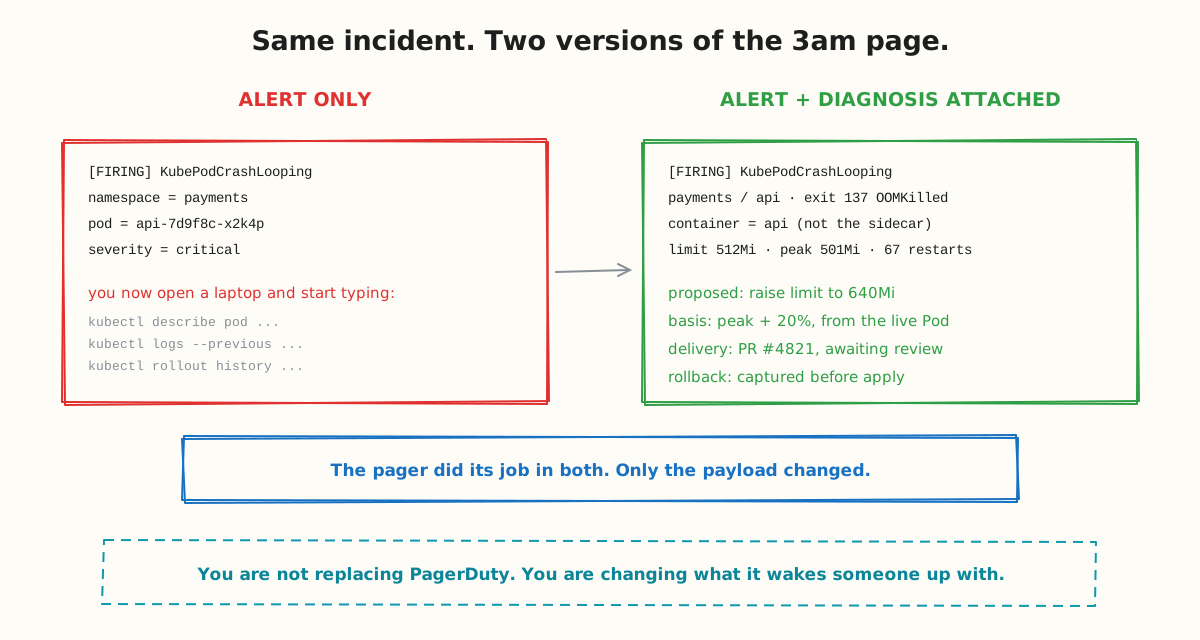
A standard KubePodCrashLooping alert tells you a pod is crash looping in a namespace. Everything else you find out yourself, starting from a laptop at 2am.
The same alert, with an agent having already read the cluster, carries the exit code and reason, which container terminated (not necessarily the first one in the pod), the current limit against observed peak, the restart count, a proposed value with the basis it was derived from, and a pull request already open for review.
The on-call engineer's first action shifts from investigate to review a proposal. That is a different cognitive task, and it is dramatically easier at 2am. The page still arrives through PagerDuty. Only the payload changed.
This is also why the two layers compose rather than compete. Grouping matters here — an agent that raises one incident per root cause instead of forty pod alerts means your escalation policy fires once, which is a direct improvement to the paging layer's output. We covered that in alert fatigue in Kubernetes.
Where the responsibilities split
| Capability | Paging tool | SRE agent |
|---|---|---|
| On-call schedules and rotations | Yes | No |
| Escalation policies | Yes | No |
| Maintenance windows and suppression | Yes | No |
| Acknowledgement SLAs and reporting | Yes | No |
| Multi-service, non-Kubernetes alerts | Yes | No |
| Reading pod specs, events and container state | No | Yes |
| Determining root cause from evidence | No | Yes |
| Proposing a specific patch with a derived value | No | Yes |
| Verifying the fix held afterwards | No | Yes |
There is no row where they overlap. That is the actual finding — these are adjacent tools, not competing ones, and any vendor pitching one as a replacement for the other is describing a product you should look at more carefully.
The honest integration position
Worth stating plainly, because this is where vendor content usually gets vague.
Atmosly Astra does not integrate with PagerDuty or Opsgenie today. Notifications reach Slack, Microsoft Teams, email and in-app, with a per-organisation severity allowlist. PagerDuty and Opsgenie webhooks are roadmap, not shipped.
What that means practically: today the agent's diagnosis lands in Slack while your page lands in PagerDuty, and the person on call correlates them. That is a real seam, and it is worth knowing before you plan around it.
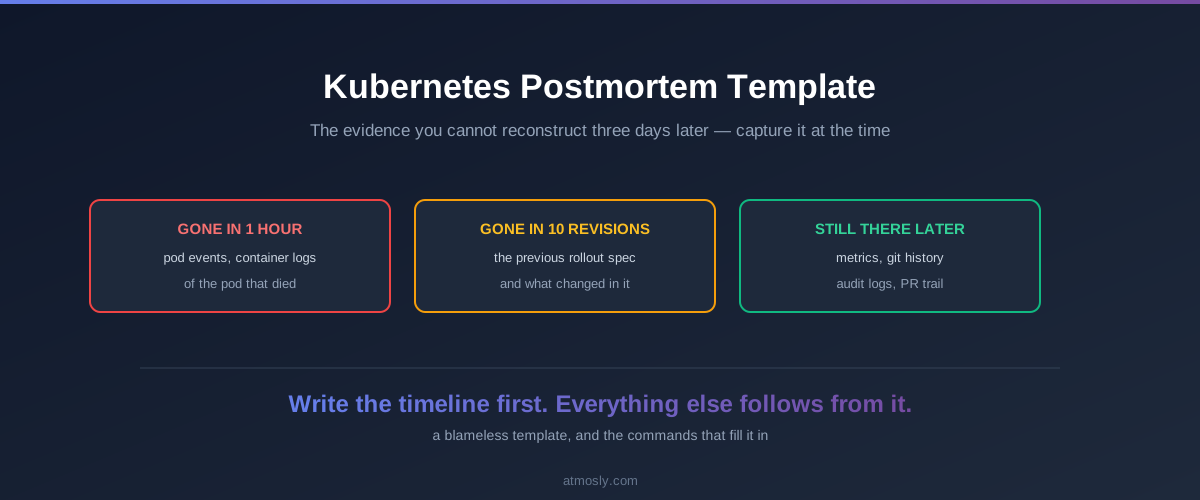
Two more limits in the same spirit. Slack integration is one-way — a card with a deep link, not interactive buttons. You cannot approve or roll back a fix from Slack. And there is no incident timeline export, so postmortem assembly stays manual; the Kubernetes postmortem template covers doing that by hand.
What to keep, what to add
A decision framework rather than a recommendation to switch.
Keep your paging tool if you have on-call rotations across more than one service, you page for anything outside Kubernetes, you have acknowledgement SLAs to report against, or you need maintenance-window suppression. All four are true for most teams past about fifteen engineers, and none of them are things an SRE agent does.
Add an agent layer if most of your incident time is spent after the page rather than before it, the same failure classes keep recurring, your on-call engineers are not the people who wrote the service, or you cannot currently answer "how long does diagnosis take us" with a number.
Do not add one if your incidents are mostly application logic rather than cluster state. An agent reading Kubernetes state can tell you a pod restarted and which container died; it cannot tell you your payment service deadlocks under a particular concurrency pattern. That boundary is real and it is roughly half of production incidents.
How to evaluate the seam
If you run both layers, these are the questions that matter:
- What does the on-call engineer see first? If the page and the diagnosis live in different tools, someone is doing correlation at 2am. Measure how long that takes before assuming it is trivial.
- Does grouping upstream reduce pages downstream? One incident per root cause should mean one page, not forty. This is the clearest measurable win from adding an agent in front of a pager.
- Can the agent's proposal be reviewed without leaving the alert? A deep link is acceptable. Re-deriving context from scratch is not.
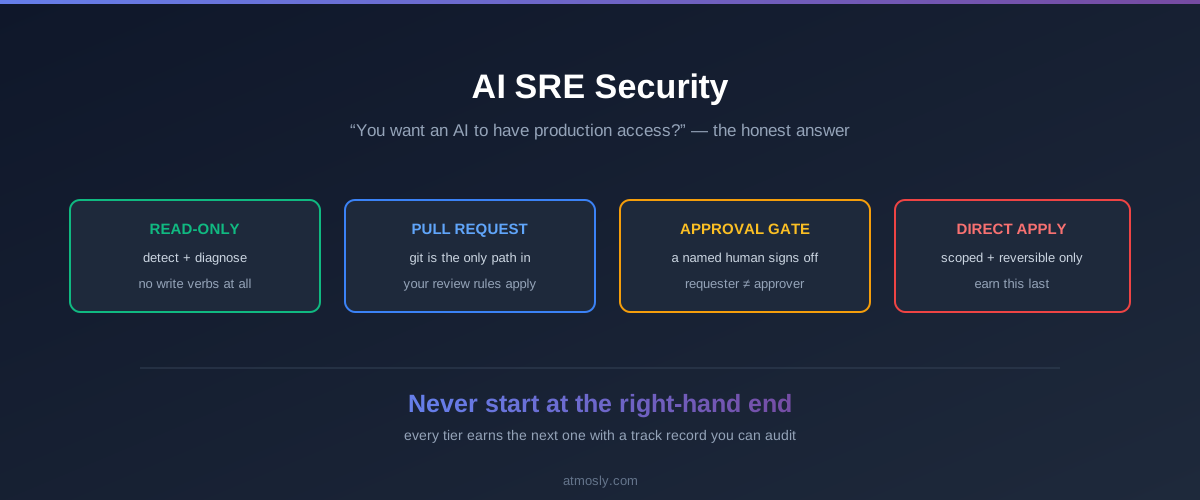
- What happens when the agent is wrong? The escalation path must still work. An agent that suppresses a page because it thinks it has handled something is a worse failure than no agent at all.
That last one is the trap. The value is in enriching what gets paged, not in deciding what does not get paged. Any tool offering to reduce your page volume by resolving things silently should be asked exactly what it does when its own fix fails — AI SRE for Kubernetes covers what verification and rollback should look like.
The short version
Detection-to-page is a solved problem and PagerDuty solves it well. Detection-to-fix is not solved, it is where roughly ninety percent of incident minutes go, and it is a different category of tool.
Run both. Judge the agent layer on whether the page arrives with a cause attached and whether the same incident stops recurring — not on whether it reduced the number of pages, which is the metric easiest to game and the one that hides the most.
You can see what arrives with the page against your own cluster without granting write access — Atmosly Astra runs read-only, and you can connect a cluster free.