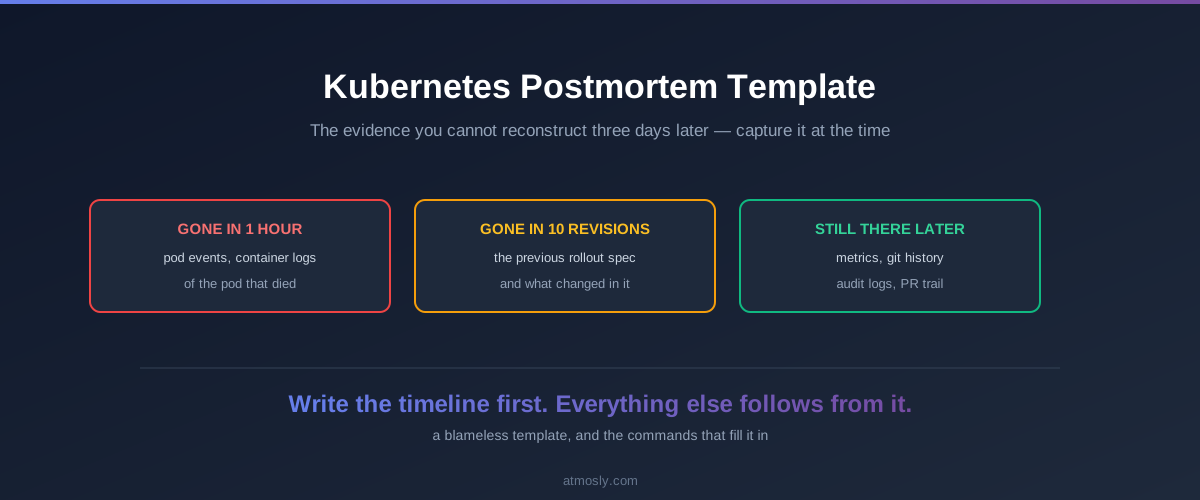
Most Kubernetes postmortems are written three days after the incident, from memory and a Slack scrollback, because the evidence that would have made them precise expired within the hour. Pod events are gone on the default one-hour TTL. The logs of the container that died are overwritten by the next restart. The ReplicaSet holding the previous spec has been garbage-collected.
This gives you a template to copy, the commands that capture the perishable evidence while it still exists, and the rewrite rule that keeps causes pointed at systems rather than people. The template is the deliverable — everything else exists to make filling it in take twenty minutes rather than an afternoon.
Capture the perishable evidence first
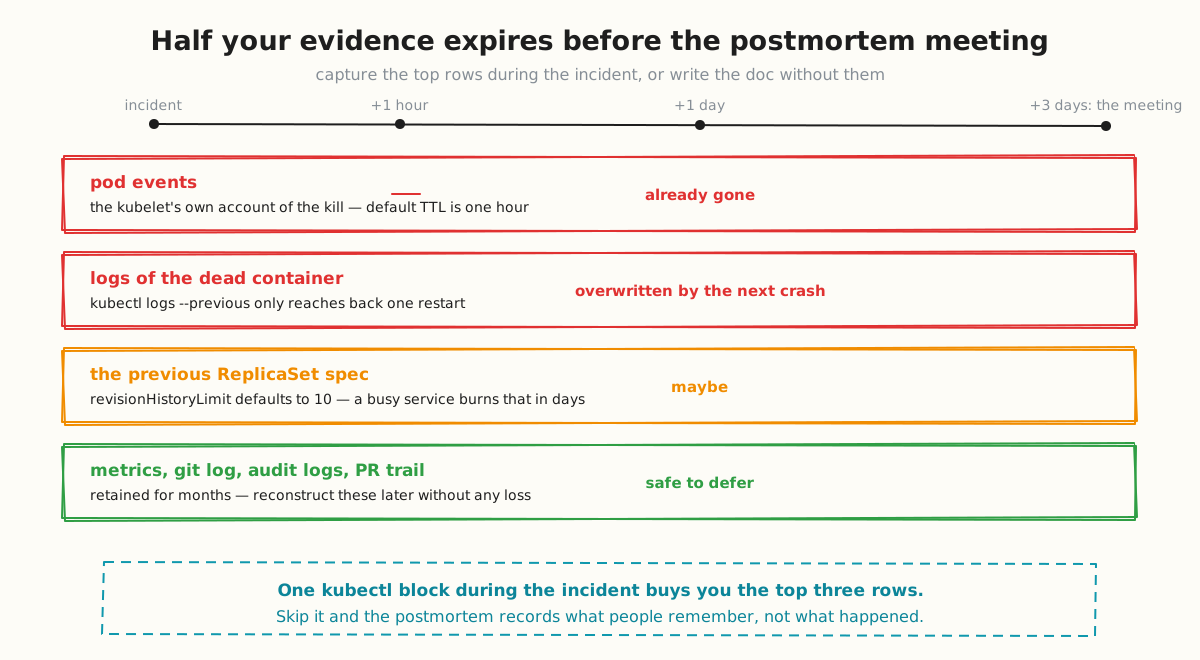
Kubernetes evidence has wildly different lifetimes, and the most diagnostic material has the shortest. Three sources are effectively gone by the time anyone schedules the review:
- Events — the kubelet's own account of why a pod was killed, rescheduled or failed to pull. Default TTL is one hour (
--event-ttlon the API server). - Logs of a terminated container —
kubectl logs --previousreaches back exactly one restart. On a crash-looping pod that window closes in seconds. - The previous ReplicaSet spec —
revisionHistoryLimitdefaults to 10, which a frequently-deployed service burns through in days.
Metrics, git history, Kubernetes audit logs and your PR trail are all retained for months. Defer those without worry.
Run this during the incident, not after. It takes seconds and it is the difference between a postmortem that cites evidence and one that cites recollection:
NS=payments
POD=api-7d9f8c-x2k4p
OUT=incident-$(date +%Y%m%d-%H%M)
mkdir -p $OUT

# 1. Events — the first thing to expire
kubectl get events -n $NS --sort-by=.lastTimestamp > $OUT/events.txt

# 2. Logs, current and previous container instance
kubectl logs $POD -n $NS --all-containers --timestamps > $OUT/logs.txt
kubectl logs $POD -n $NS --previous --all-containers --timestamps > $OUT/logs-previous.txt 2>/dev/null

# 3. Full pod state, including terminated container exit codes
kubectl get pod $POD -n $NS -o yaml > $OUT/pod.yaml
kubectl describe pod $POD -n $NS > $OUT/describe.txt

# 4. Owning workload and its rollout history
kubectl get deploy -n $NS -o yaml > $OUT/deployments.yaml
kubectl rollout history deploy/api -n $NS > $OUT/rollout-history.txt

# 5. Node conditions, if the symptom was scheduling or eviction
kubectl describe node $(kubectl get pod $POD -n $NS -o jsonpath='{.spec.nodeName}') > $OUT/node.txt
The single most valuable field in that capture is the terminated container's exit code and reason, which lives in the pod YAML under status.containerStatuses[].lastState.terminated. Exit code 137 with reason OOMKilled settles an argument that otherwise runs for twenty minutes in the review.
What an agent captures without being asked
An agent that diagnoses at detection time collects the perishable material as a side effect, because it needs the same data to reach a diagnosis. Atmosly Astra reads the live Pod object the moment the issue fires and records the current memory limit and request, the name of the container that terminated and its reason, the restart count, and the controller that owns the pod resolved from ownerReferences rather than guessed from the pod name. That is the top of the decay table captured without anyone remembering to run anything.
Capture the evidence without remembering to.
Connect a cluster read-only in about 5 minutes. The agent reads pod state and events at detection, while they still exist.
Where a fix was applied, the audit row is already a partial timeline: who requested the change, who approved it, the exact patch, the rollback specification captured beforehand, whether an operator edited the suggested value, and the post-apply verification verdict. Those map onto the template's timeline and evidence sections directly. If the fix went out as a pull request, the PR link and its merge state are on the same record — GitOps remediation for Kubernetes covers that ledger.
Two honest limits. It does not write the postmortem, and nothing in this category does — the analysis is the part that matters and it stays yours. And closure notes are stored and displayed but are not fed back into diagnosis, so the agent does not learn from your previous incidents. Treat the captured evidence as a better starting point, not a finished document.
The template
Copy this. It is deliberately short — a template nobody completes is worse than a brief one everybody does.
# Incident: [one line, what users experienced]

**Date:** 2026-08-04
**Duration:** 14:02–14:51 UTC (49 min)
**Severity:** SEV2
**Author:** [name]
**Status:** draft | in review | actioned

## Impact
Who was affected, how many, and what they could not do.
Use numbers: "checkout failed for ~8% of sessions for 49 minutes",
not "some users saw errors".

## Timeline (UTC)
| Time  | Event | Source |
|-------|-------|--------|
| 14:02 | Memory limit breached, first OOMKill | pod events |
| 14:04 | Error rate alert fired | Alertmanager |
| 14:09 | On-call acknowledged | PagerDuty |
| 14:23 | Root cause identified: limit unchanged since v1.2 | describe.txt |
| 14:38 | Limit raised 512Mi → 1.5Gi, rollout started | PR #4821 |
| 14:51 | Error rate normal, verified stable | Grafana |

## What happened
Three to five sentences. Mechanism, not narrative.

## Why it happened
The chain, each link a system:
1. Traffic grew 40% over six weeks
2. Memory scaled with connection count
3. No alert existed on memory headroom
4. Limit had not been revisited since the service was written

## What went well
Genuinely — this is not filler. It tells you which
controls to protect during the next round of cost cuts.

## What did not
Detection gaps, tooling gaps, missing runbooks, unclear ownership.

## Action items
| Action | Owner | Due | Ticket |
|--------|-------|-----|--------|
| Alert on memory headroom <20% | @owner | 2026-08-11 | SRE-412 |
| LimitRange on the namespace | @owner | 2026-08-18 | SRE-413 |

## Evidence
Links to the capture directory, the PR, dashboards, the incident channel.
Write the timeline first
Everything else in the document falls out of the timeline, so build it before writing prose. Two rules make it useful.
Cite a source per row. A timeline entry with no source is someone's recollection, and recollections compress. "We noticed around 14:10" reliably means 14:23 when you check the Slack timestamp.
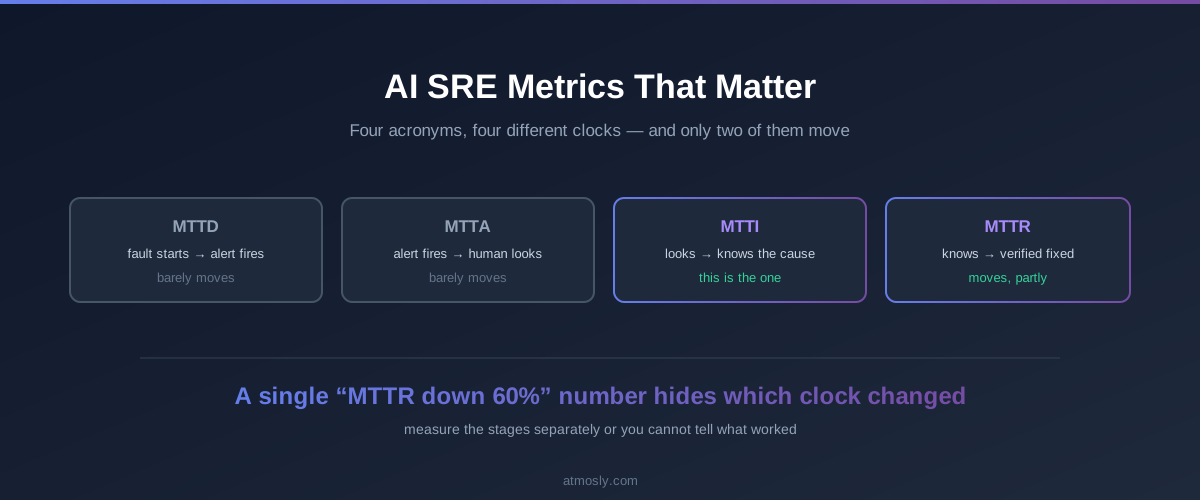
Separate when it broke from when you noticed. These are different rows and the gap between them is your real detection latency. Teams that collapse them lose the single most actionable number in the document. That gap is MTTD, and AI SRE metrics covers how the incident clocks relate.
Timestamps come from four places, in descending order of trustworthiness: Kubernetes events and audit logs, monitoring system alert times, git and PR timestamps, then chat. Chat is last because people write about things minutes after doing them.
Blameless means naming systems, not softening language
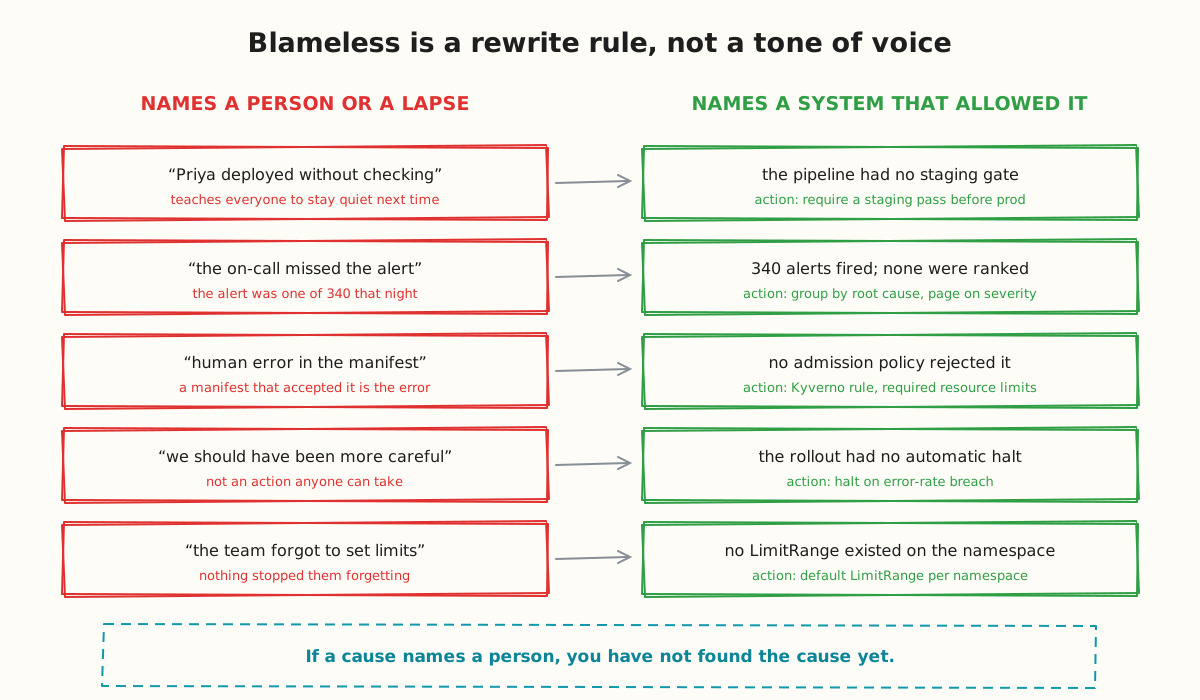
Blameless postmortems are widely misread as a politeness requirement. They are a rewrite rule with a testable output: if a cause names a person, you have not found the cause yet.
"Priya deployed without checking" is not a cause. The cause is that the pipeline let an unchecked deployment reach production. One of those has an action item; the other teaches everyone to stay quiet next time, which costs you the information you need to prevent the next incident.
The test is mechanical. Read each cause and ask what action it produces. "We should have been more careful" produces nothing. "The rollout had no automatic halt on error-rate breach" produces a specific piece of work.
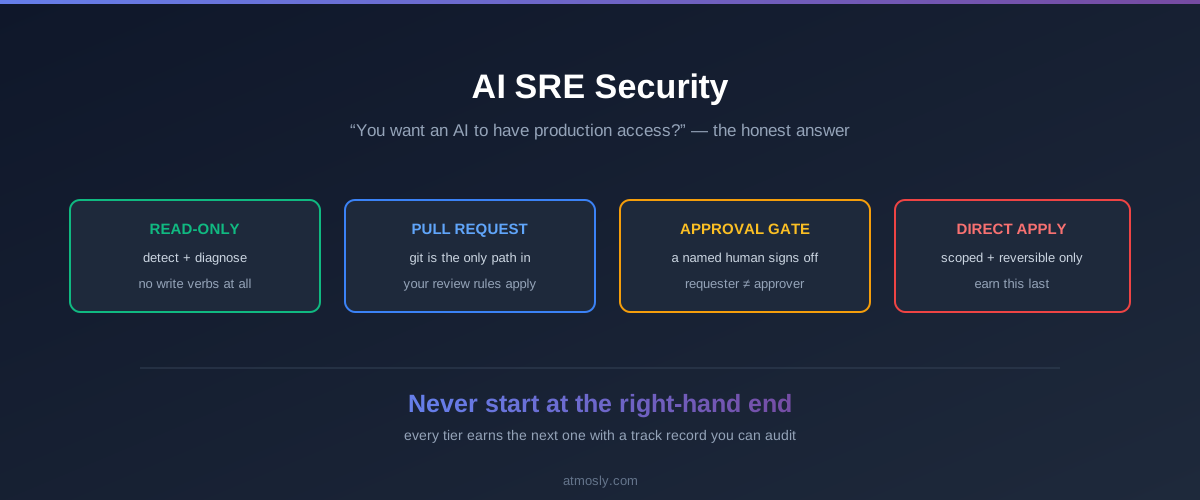
This also applies to automated fixes. If an agent applied a change that made things worse, the cause is not "the AI got it wrong" — it is that a change with that blast radius was allowed to apply without review, or that verification took too long to catch the regression. Same rule, same rewrite. AI SRE security covers where those gates belong.
Action items that survive the week
The most common failure of postmortem culture is not writing bad documents. It is writing good ones whose action items quietly never happen.
Four rules that hold up:
- A named person, not a team. A team owns nothing.
- A ticket in the tracker your team actually works from, linked bidirectionally. An action item living only in a postmortem document is a wish.
- Two weeks maximum. A due date beyond that is a way of saying no politely. If the work is genuinely large, split it and land the first slice inside two weeks.
- Cap at five. A postmortem with fourteen action items produces zero completed ones. Rank ruthlessly and let the rest go.
Review completion at the following month's operations review. A postmortem process with no completion check degrades into documentation theatre within a quarter, and the second one is harder to fix than the first.
When to write one
Write a postmortem when there was customer impact, when an incident recurred, when the response revealed a tooling or process gap, or when a near miss would have been severe had it landed differently. Near misses are the highest-value and most-skipped category — all the learning, none of the damage.
Do not write one for a single pod restart that self-healed, for a known issue with an open ticket, or for the fourth instance of something whose fix is already in flight. Postmortem fatigue is real, and it is caused by writing them for events with nothing to learn.
Recurrence is the signal worth watching. If the same incident class returns three times, the postmortems are being written and their action items are not landing — which is a process problem, not a Kubernetes one. Grouping recurrences under one incident record makes that visible, and alert fatigue in Kubernetes covers the mechanics.
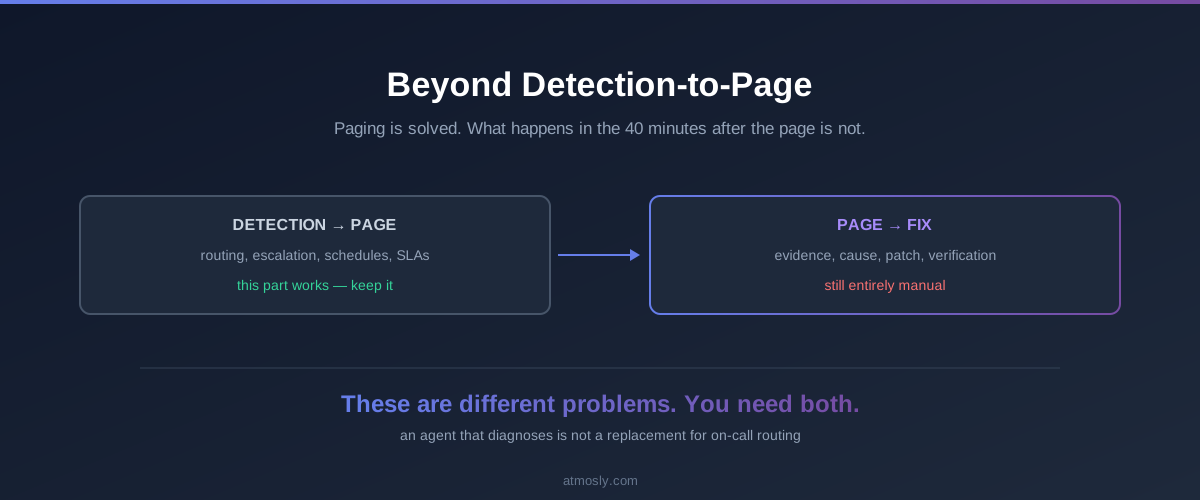
For the wider picture of how detection, diagnosis and verification fit together around this, see the AI SRE for Kubernetes guide.
If you want the perishable evidence captured without remembering to run anything, an agent that diagnoses at detection time collects it as a side effect — Atmosly Astra runs read-only, and you can connect a cluster free.