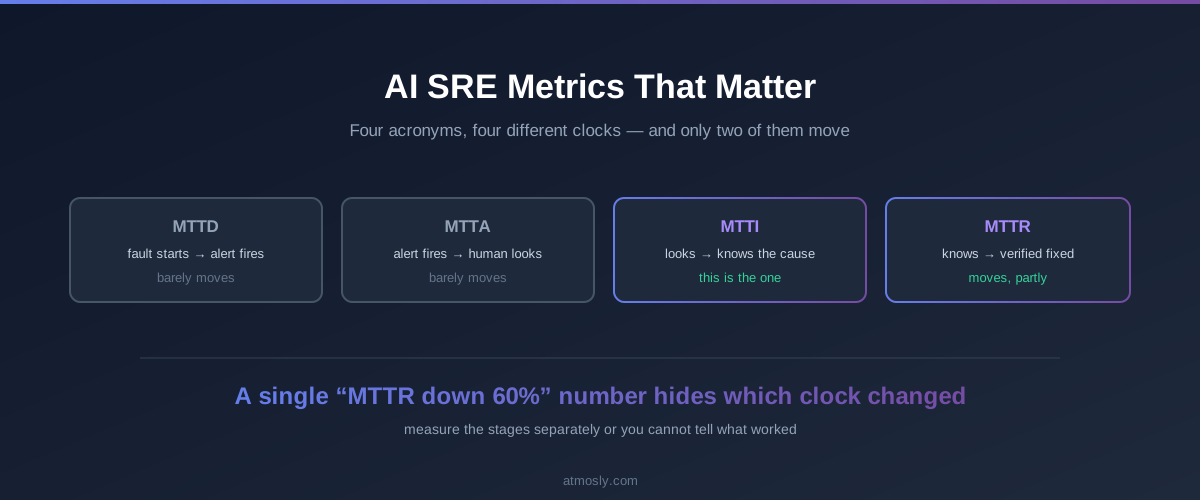
Adding an AI agent to incident response moves two of the four standard incident clocks, barely touches the other two, and creates a handful of new metrics nobody was tracking before. A single headline number like "MTTR down 60%" hides which of those happened, which makes it useless for deciding whether to expand automation or roll it back.
This defines each incident metric precisely, shows which ones an agent genuinely changes and why, covers the agent-specific metrics worth starting to track, and gives the questions that deflate an impressive dashboard. For cluster resource metrics — golden signals, PromQL, what to alert on — see Kubernetes metrics: what to monitor and why. This piece is about incident metrics only.
MTTD vs MTTA vs MTTI vs MTTR
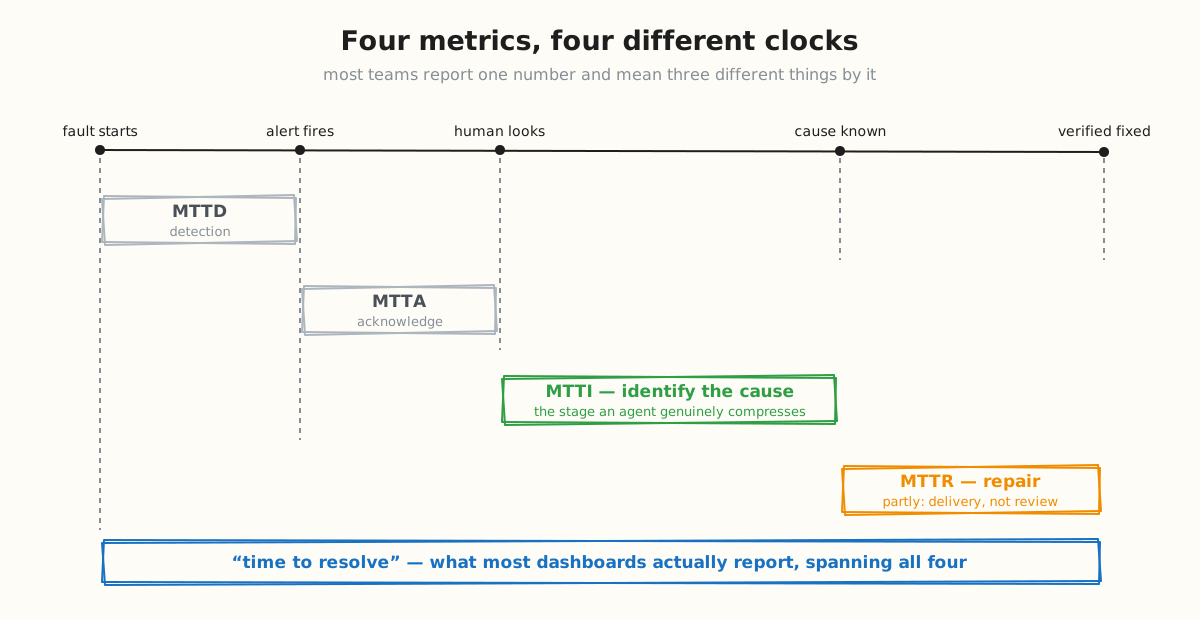
Most teams report one number and mean three different things by it. The four standard metrics measure different intervals, and conflating them is why cross-team comparisons are meaningless.
| Metric | Measures | Formula |
|---|---|---|
| MTTD — detect | Fault begins → alert fires | Σ(alert_time − fault_start) / incidents |
| MTTA — acknowledge | Alert fires → a human engages | Σ(ack_time − alert_time) / incidents |
| MTTI — identify | Engagement → root cause known | Σ(cause_time − ack_time) / incidents |
| MTTR — repair | Cause known → verified resolved | Σ(resolved_time − cause_time) / incidents |
Two definitional traps worth naming.
MTTR is four different metrics wearing one acronym — repair, recovery, respond, resolve. They span different intervals and vendors pick whichever flatters the number. Always ask which start and stop events are being used.
MTTD depends on knowing when the fault started, which you frequently do not. A memory leak that OOMKills after six hours started six hours ago, not when the alert fired. Teams that measure MTTD from first symptom rather than first alert get a number that is honest and much worse. Use the honest one.
Which metrics actually change with an AI agent
Here is the answer most vendor content avoids giving directly.
| Metric | Change | Why |
|---|---|---|
| MTTD | Little | Bounded by your telemetry scrape interval, not by intelligence |
| MTTA | Little | Bounded by human availability and pager routing |
| MTTI | Large | Evidence gathering and correlation is exactly what an agent replaces |
| MTTR | Partial | Delivery gets faster; review time does not |
MTTD barely moves because detection latency is a function of how often you scrape, not how clever the analysis is. If Prometheus scrapes at 30s and your alert needs three consecutive failures, your floor is 90 seconds. No agent changes that arithmetic.
There is one exception worth noting: grouping changes the denominator. If forty pod alerts become one incident, your per-incident averages shift without any underlying improvement. That is a measurement artefact, not a win — and it is the single most common way these numbers get accidentally inflated. We covered the grouping mechanics in alert fatigue in Kubernetes.
Build the baseline before you enable anything.
Connect a cluster read-only in about 5 minutes and start capturing diagnosis data. No write access, nothing changes in your cluster.
MTTA barely moves because it measures how fast a human responds to a page. Unless the agent resolves the issue without paging anyone — in which case the incident leaves your MTTA sample entirely, which again shifts the average through selection rather than improvement.
MTTI is where the real change happens. The interval between an engineer opening the incident and knowing the cause is spent reading logs, checking recent deploys, comparing pod specs and correlating events. That is mechanical evidence work, and it is precisely what an agent does before a human arrives. If you measure one thing, measure this one.
MTTR moves partially. The mechanical part — constructing the patch, targeting the right object, opening the PR — compresses. The review cycle does not, and should not. A team delivering fixes by pull request will see MTTR improve less than one applying directly, and that is a deliberate trade rather than a failure. For the full method of reducing it, see how to reduce MTTR in Kubernetes.
AI SRE metrics worth tracking
Four that do not exist in a pre-agent world, and are more useful than any of the classic four for deciding whether to widen autonomy.
Proposal acceptance rate. Of the fixes proposed, what share were applied unchanged? A low rate means the agent is not yet trustworthy; a rate near 100% may mean nobody is reviewing properly.
Value override rate. When a fix carries a number — a memory limit, a replica count — how often does the operator change it before approving, and in which direction? This is the sharpest calibration signal available. Operators consistently reducing proposed limits means the sizing logic is over-provisioning, and you can only see that if the record stores both the suggested and applied values. AI SRE security covers what the audit record needs to capture.
Verification verdict distribution. Of applied fixes, what share verified healthy, still firing, or regressed? A rising regression share is an early warning that the proposal quality is drifting.
Recurrence rate within 7 days. The only real proof a fix held. An incident marked resolved that returns on Thursday was not resolved; it was suppressed. This is the number that catches an agent optimising for closure over correctness.
Error budgets and where agents fit
An error budget is the amount of unreliability your SLO permits over a window. If your availability target is 99.9% over 30 days, the budget is:
error_budget_minutes = 30 days × 24 h × 60 min × (1 − 0.999)
                     = 43,200 × 0.001
                     = 43.2 minutes
Burn rate is what you alert on — the multiple at which you are consuming budget relative to the pace that would exhaust it exactly at window end. A burn rate of 1 lands you at zero on the final day. A burn rate of 14.4 exhausts a 30-day budget in about 50 hours. Google's SRE Workbook chapter on alerting on SLOs is the canonical treatment of multi-window burn-rate alerts.
An agent affects the budget through the middle of the incident, not the ends. Shortening MTTI shortens total downtime, which preserves budget. But an agent applying a wrong fix and taking three minutes to detect the regression spends budget faster than a human who paused to think.
The useful framing: error budget policy should govern how much autonomy you allow. Plenty of budget remaining is when you can afford to let an agent apply directly. Nearly exhausted is when everything should route through review. That mapping is a policy your team writes — Atmosly does not currently enforce autonomy tiers based on budget consumption, and no tool in this category does it well yet.
Vanity metrics to ignore
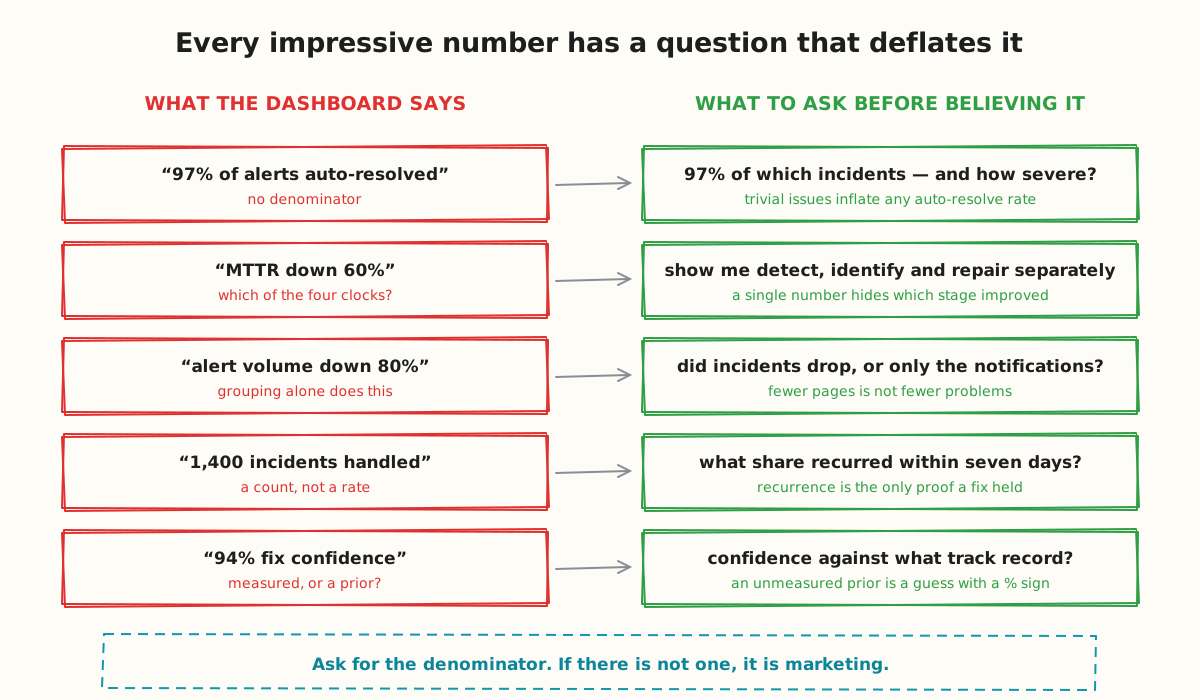
Five numbers that look strong and mean little without a follow-up question.
"97% of alerts auto-resolved" — 97% of which alerts? If the denominator includes every transient blip, the rate is inflated by triviality. Ask for the rate restricted to incidents that actually paged someone.
"MTTR reduced 60%" — which of the four clocks? A 60% cut in a metric spanning detect through resolve is consistent with a large MTTI improvement and no change anywhere else, which is a real but much narrower claim.
"Alert volume down 80%" — grouping forty pod alerts into one incident produces exactly this with no reliability improvement whatsoever. Fewer notifications is not fewer problems. It is a real benefit for on-call load and it is not a reliability metric.
"1,400 incidents handled" — a count with no denominator and no outcome. Handled how, and what share came back?
"94% fix confidence" — measured against what track record? Confidence scores in this category frequently start from a hand-set prior and only blend toward empirical data once samples accrue. Atmosly labels its confidence figure as estimated for exactly this reason. Ask any vendor how many real outcomes sit behind the number.
How to measure this today
Worth being direct: Atmosly does not currently report MTTR, auto-resolution rate or fix success rate. There is no metrics dashboard for agent effectiveness. If you want these numbers, you build them, and most tools in this category are in a similar position regardless of what their marketing pages imply.
What you can do without vendor support:
- Timestamp the stages in your incident tracker. Four fields — detected, acknowledged, cause identified, verified resolved. Without these you cannot compute anything, and adding them costs one schema change.
- Record whether the agent was involved, and how. Not involved, diagnosed only, proposed a fix, fix applied. This is your control group.
- Baseline for a month before enabling anything. Without a before, every number afterwards is unfalsifiable.
- Segment by severity. Aggregate MTTI across every severity is dominated by whichever tier has the most incidents.
- Use medians, and report p90 alongside. One eight-hour incident drags a mean into meaninglessness. The median tells you the typical case; p90 tells you the bad one.
That last point matters more than it sounds. If a vendor quotes a mean without a median, they are quoting the number more sensitive to outliers in whichever direction suits them.
The short version: track MTTI as your primary signal, recurrence rate as your correctness check, and override rate as your calibration signal. The other numbers are context.
You can measure the diagnosis stage against your own incidents without granting write access — Atmosly Astra runs read-only, and you can connect a cluster free to build the baseline.