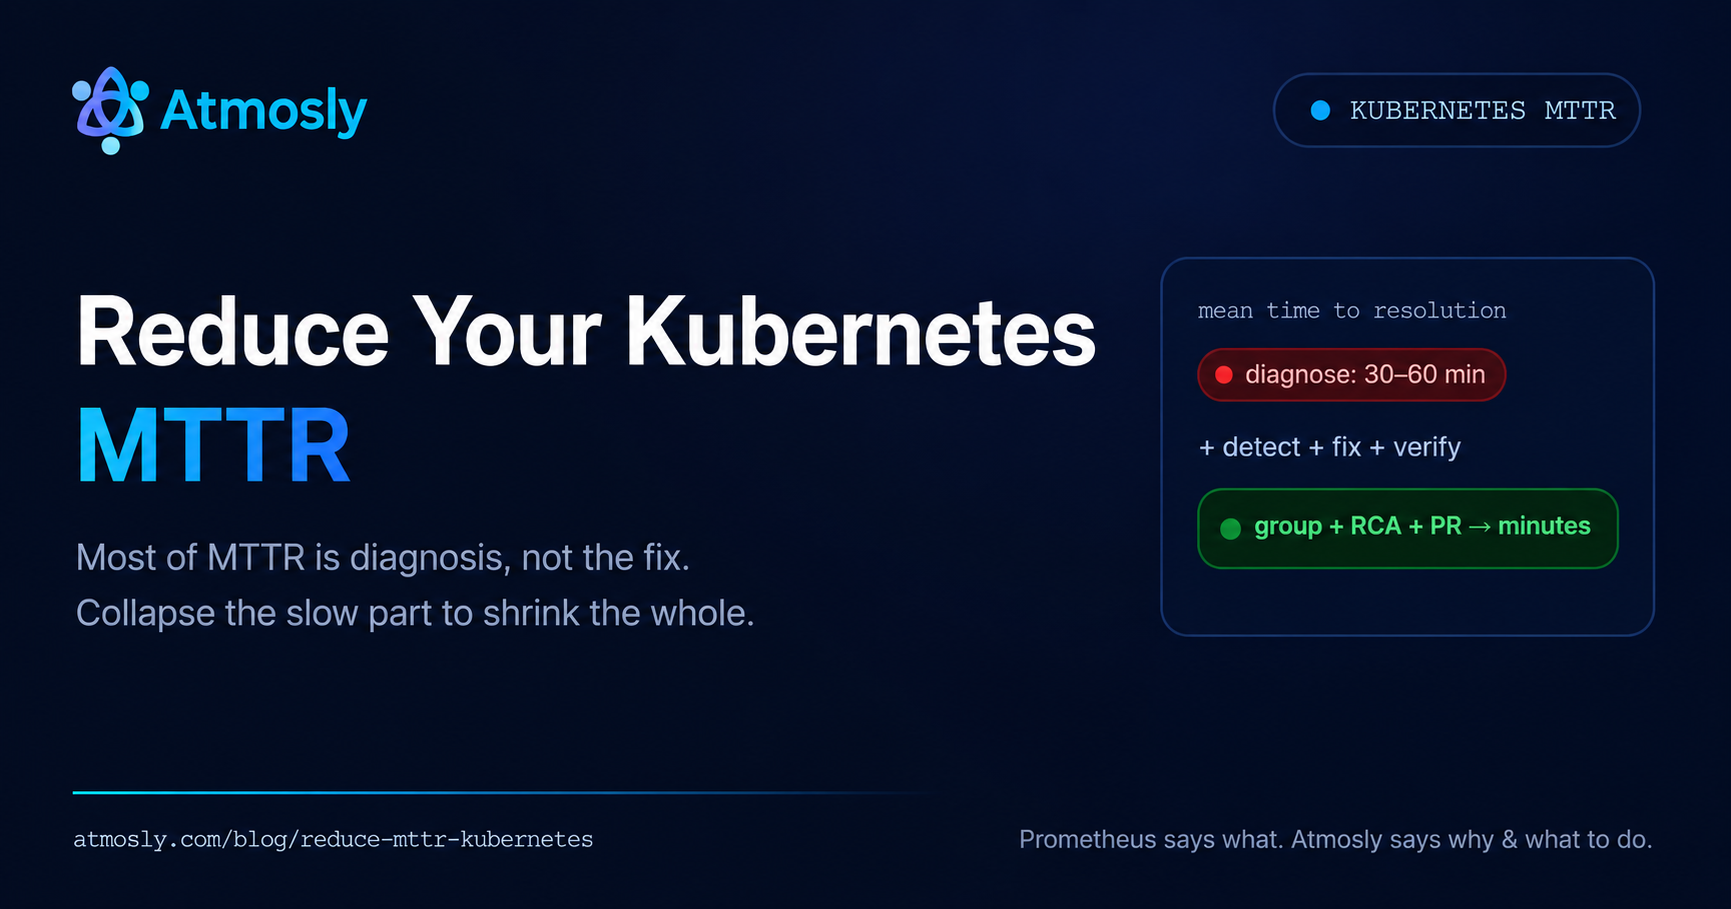
MTTR is the number engineering leaders actually report on. When a Kubernetes incident drags from minutes into hours, the cost is measured in downtime, missed SLOs, and burned-out on-call. The instinct is to try to "fix faster" — but on Kubernetes, the fix is rarely the slow part. Most of MTTR is spent figuring out what broke, not applying the change. That is where the reduction lives.
This guide breaks down what MTTR means, where the time actually goes in a Kubernetes incident, and six concrete ways to reduce MTTR in Kubernetes — from unified telemetry and incident grouping to AI root-cause analysis and automated GitOps remediation.
What MTTR means (and the metrics around it)
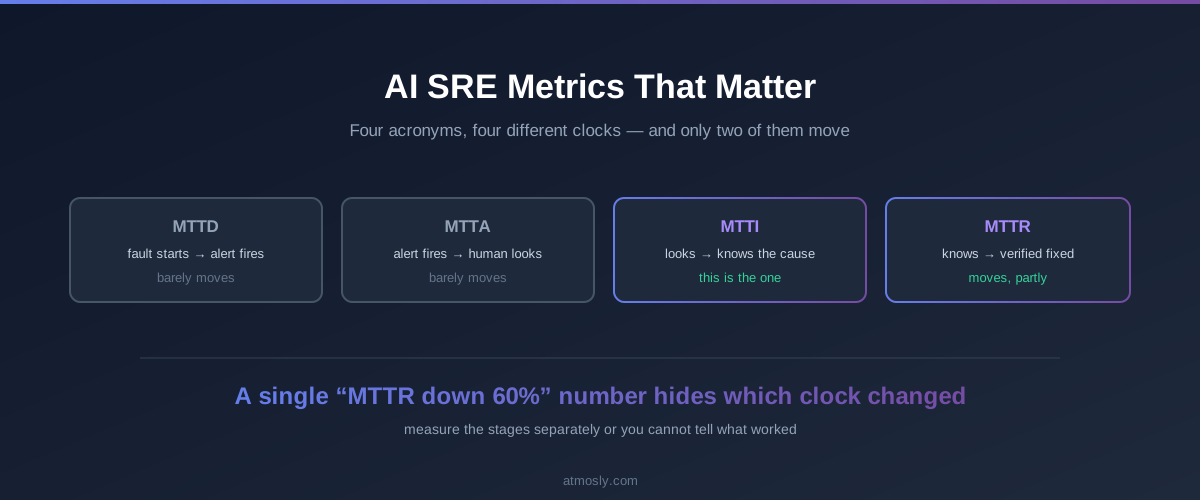
MTTR usually stands for mean time to resolution (or repair/recovery) — the average time from an incident starting to it being fully resolved. It is one of a family of incident metrics worth separating, because each points to a different fix:
- MTTD (detect): time from failure to the system noticing. Fixed with better monitoring coverage.
- MTTA (acknowledge): time from alert to a human engaging. Fixed with routing and on-call hygiene.
- MTTR (resolve): time from detection to full resolution. Dominated, in Kubernetes, by diagnosis.
Standard definitions for these are laid out in resources like the Google SRE book. The one to attack first is usually MTTR, and within it, the diagnose stage.
Where Kubernetes MTTR actually goes
Break a typical incident into stages and the imbalance is obvious. Detection and the actual fix are quick; diagnosis is where 30 to 60 minutes disappear — correlating alerts, reading logs across services, and reconstructing what changed.
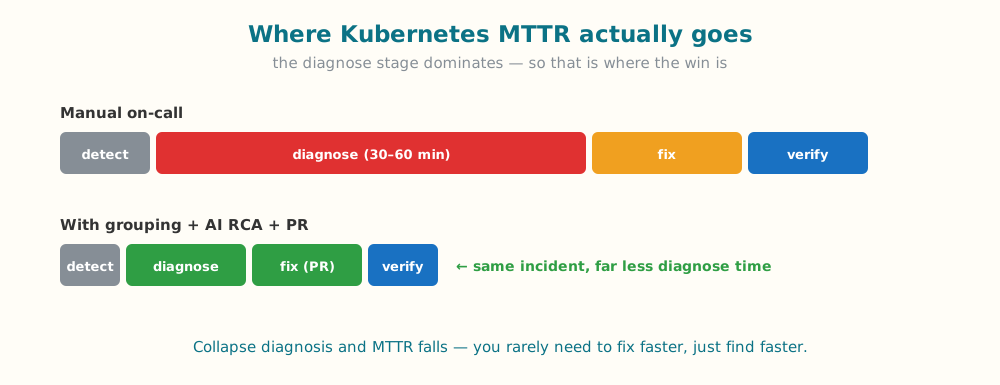
The diagnose stage dominates. Collapse it and MTTR falls — you rarely need to fix faster, just find faster.
Industry reporting backs this up: the average Kubernetes incident runs roughly 45 to 90 minutes, most of it in figuring out the problem, while elite teams with correlation and automated remediation resolve common incidents in under ten. The lever is not typing the fix quicker — it is removing the manual archaeology before it.
Kubernetes MTTR benchmarks: what good looks like
There is no single "correct" MTTR — it depends on severity and system complexity — but industry reporting gives rough tiers to calibrate against. Use them to set a target, not as a vanity number:
| Tier | Typical MTTR (common incidents) | What they have in place |
|---|---|---|
| Traditional | 45–90 min | Manual triage, siloed dashboards, tribal knowledge |
| Improving | 15–30 min | Unified telemetry, alert correlation, runbooks |
| Elite | Under 10 min | AI root-cause, incident grouping, automated remediation |
The jump between tiers is almost entirely about how fast a team gets from alert to a confident root cause — not how fast they type the fix. That is why the strategies below concentrate on the diagnose stage.
Why MTTR is the metric leaders watch
MTTR is a business metric wearing an engineering label. Every minute a customer-facing service is degraded maps to lost revenue, SLA credits, and eroded trust — industry estimates commonly put the cost of downtime in the thousands of dollars per minute for larger SaaS operations. It is also an engineering-health metric: teams with high MTTR run longer war rooms, accumulate more toil, and burn out on-call faster. Lowering MTTR is therefore one of the few initiatives that improves the customer experience, the P&L, and retention at the same time — which is why it lands on leadership dashboards rather than staying an SRE curiosity.
Six ways to reduce MTTR in Kubernetes
- Unify your telemetry. Context-switching across eight tools per incident is pure MTTR. A single pipeline — metrics, logs, traces, and Kubernetes events in one place, typically via OpenTelemetry — removes the tab-hopping. Our guide to debugging Kubernetes pods covers the signals that matter.
- Correlate and group alerts. Ten crash-looping pods of one Deployment should be one incident, not ten pages. Grouping by workload identity cuts the triage tax at the front of the incident — the mechanics are in our post on Kubernetes alert fatigue.
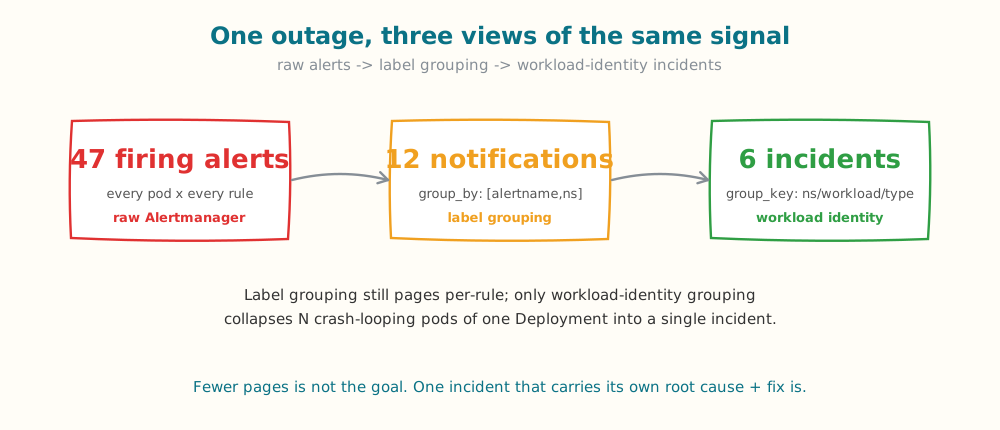
Fewer, better-scoped incidents mean less time spent deciding what is actually broken.
- Pattern-match against past incidents. A large share of incidents are variations of previous failures. When on-call can see "this looks like the outage from three months ago, here is what fixed it," they skip the exploration entirely. The practical mechanism is a required closure note tied to the failing workload plus an occurrence count, so the second time a CrashLoop appears it arrives with the prior fix attached instead of a blank terminal. Institutional memory is a direct MTTR lever.
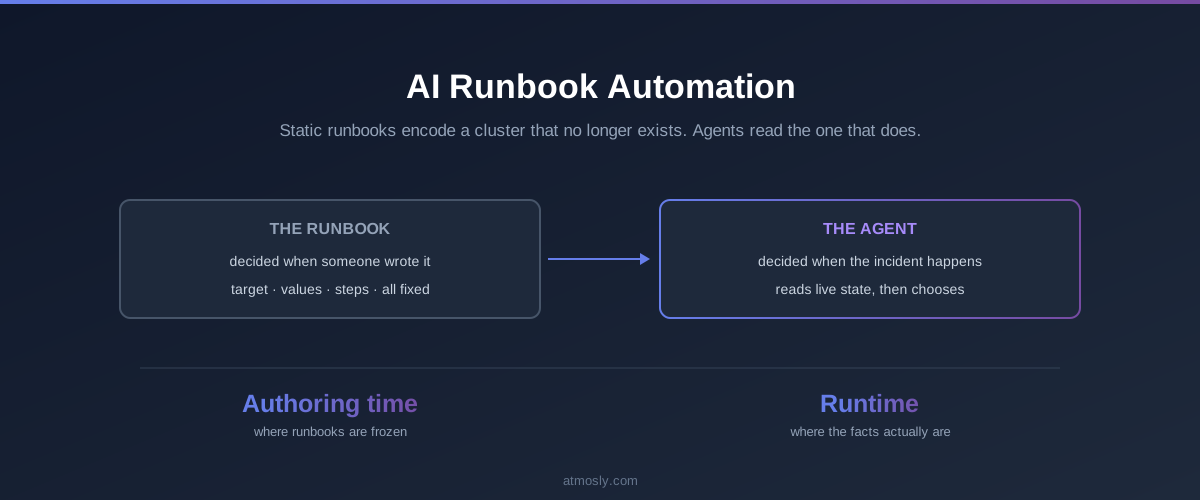
- Use AI for root-cause analysis. The diagnose stage is exactly where AI helps — reading the live object state, recent events, resource evidence, and the last deploys, then ranking hypotheses and surfacing the likely cause in seconds instead of a manual hunt across dashboards. Grounding the analysis in real cluster evidence (not just log text) is what makes the output trustworthy, and it is the axis that separates an AI SRE agent from AIOps.
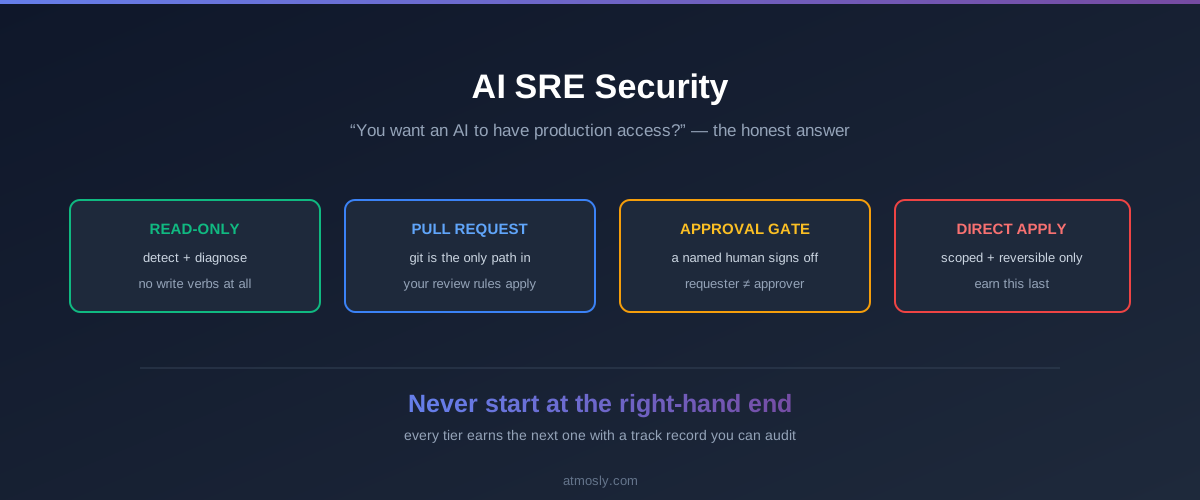
- Automate the fix as a pull request. Once the cause is known, the remaining time is writing and shipping the change. Drafting it as a reviewable GitOps remediation PR removes the context-switch from dashboard to editor to terminal — and keeps a human on the merge.
- Prevent the repeat. Right-sizing, sane probes, and chaos testing shrink the incident rate itself. Fewer incidents is the ultimate MTTR reduction; our OOMKilled fix guide is a good example of turning a recurring failure into a one-time fix.
How Atmosly compresses Kubernetes MTTR
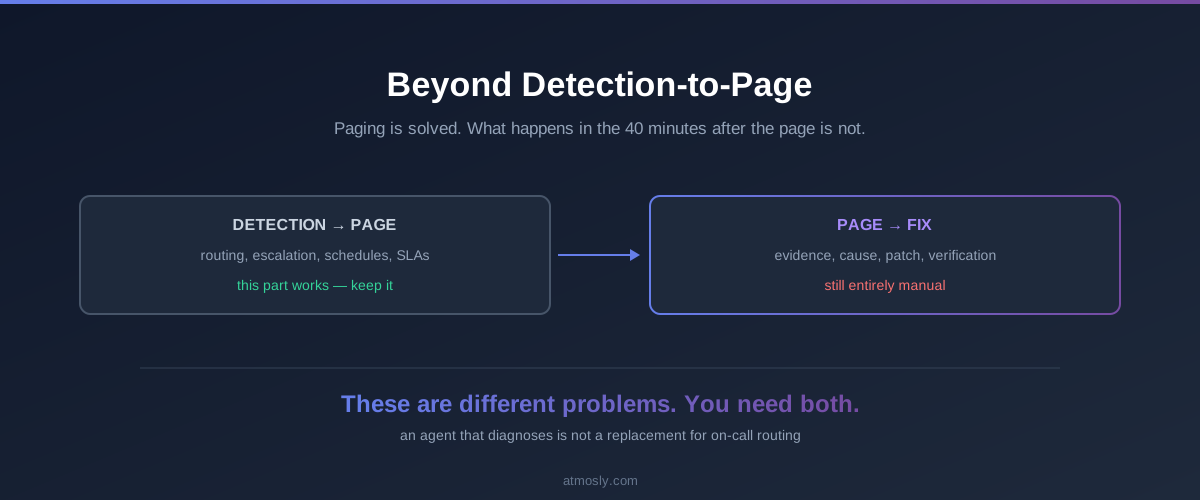
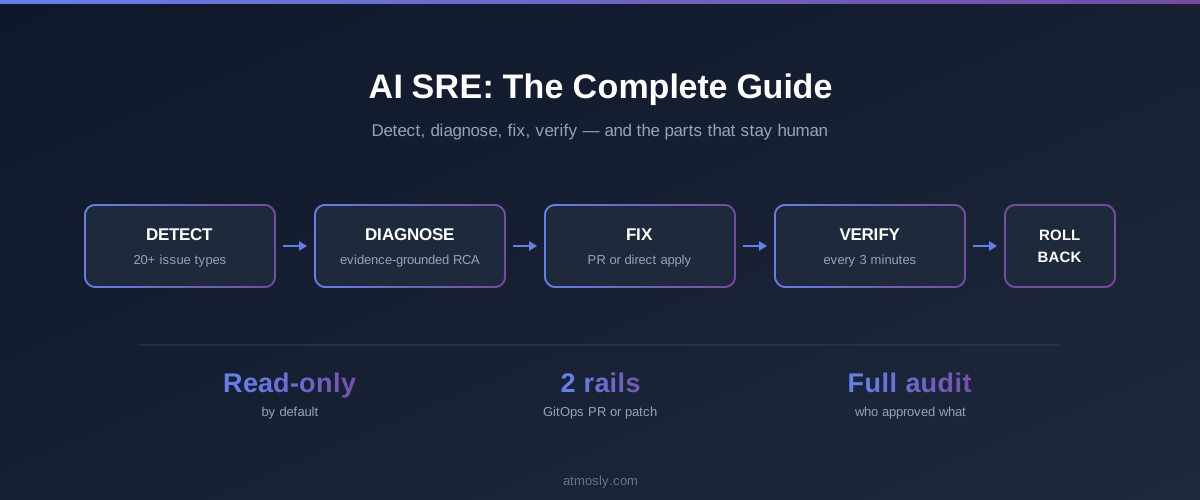
Atmosly's AI SRE agent targets the two stages that dominate MTTR. It groups a failing workload's noise into a single incident, produces an evidence-grounded root cause, and drafts the fix as a reviewable GitOps pull request — so the slow diagnose stage collapses and the fix arrives ready to approve. A human still merges the PR, and detection is read-only, so speed does not come at the cost of control. Rather than quote a headline percentage, the honest framing is the one on the diagram above: attack diagnosis, and the whole timeline shrinks.
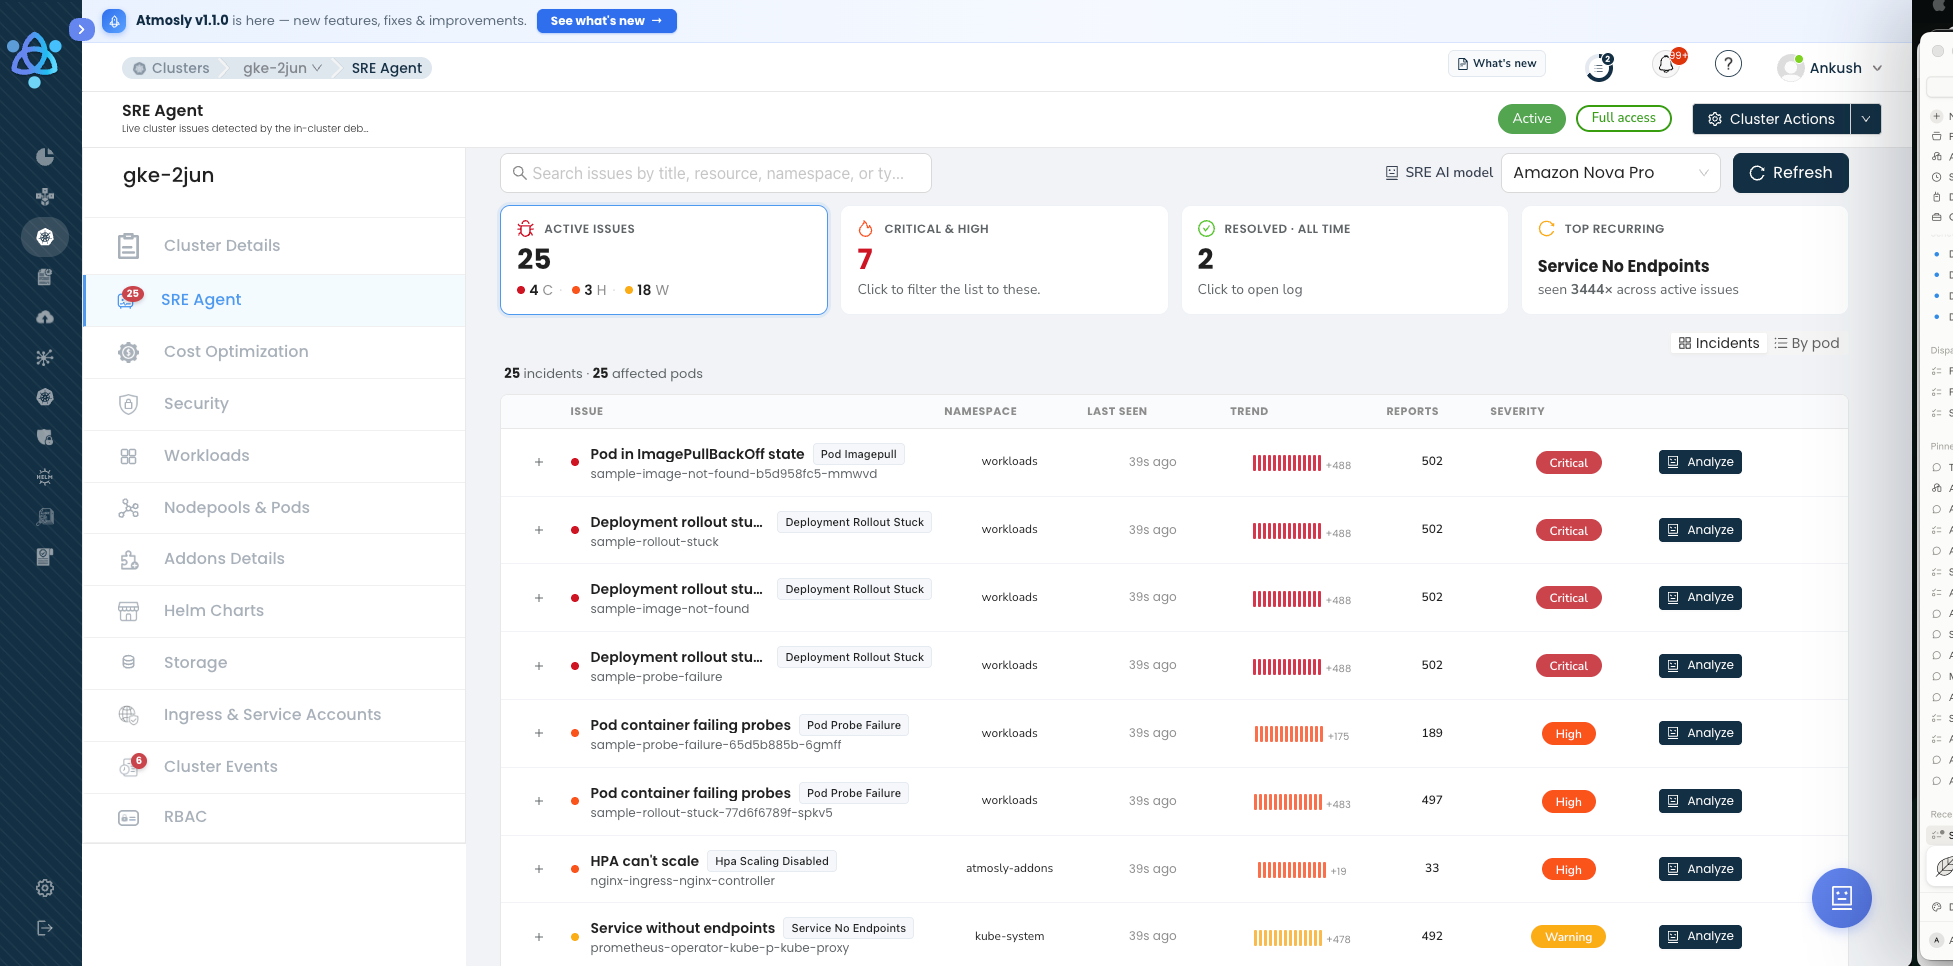
The same failing workload can report hundreds of times. Grouping it into one incident with a severity and a trend is what turns a wall of alerts into a queue you can work through.
How to measure MTTR reduction
Instrument the stages separately so you know which lever is working:
- Stage timings: track detect, diagnose, fix, and verify as distinct spans. If diagnose dominates, grouping and RCA are your highest-leverage changes.
- Alerts-per-incident: a ratio well above 1 means fan-out is inflating triage time.
- Recurrence rate: how often the same incident class returns — the target for pattern-matching and prevention.
- MTTR by severity: report critical-incident MTTR separately; that is the number the business feels.
Common mistakes that inflate Kubernetes MTTR
Before adding tooling, remove the self-inflicted delays. These four patterns quietly stretch resolution time on almost every team:
- Alerting on causes instead of symptoms. A rule per failure mode buries the one that matters. Page on user-visible SLO burn, and let diagnosis find the cause — fewer, higher-signal alerts shorten both MTTA and diagnose time.
- Fan-out with no grouping. Ten alerts for one failing Deployment forces engineers to deduplicate by hand before they can even start. Grouping by workload identity removes that step entirely.
- Losing incident knowledge. When triage notes die in a closed Slack thread, the next engineer re-derives the same root cause months later. Without a durable record, every recurrence pays full diagnose cost again.
- Fixing on the live cluster. A quick kubectl patch on a GitOps-managed workload gets reverted at the next sync, so the incident reopens and MTTR is effectively infinite until someone commits the change to Git.
None of these need a new product to fix — they need alerting discipline, grouping, a record of past fixes, and a GitOps-correct remediation path. Tooling then compounds the gains.
Key takeaways
- In Kubernetes, MTTR is dominated by diagnosis, not by applying the fix — so that is where to focus.
- Unify telemetry and group alerts to cut the triage tax at the front of every incident.
- AI root-cause analysis and pattern-matching collapse the diagnose stage from tens of minutes toward seconds.
- Automate the fix as a reviewable GitOps PR to remove context-switching from the back of the incident, with a human on the merge.
- Measure stage timings, alerts-per-incident, and recurrence to prove which lever actually moved MTTR.
Want to see your diagnose stage collapse on a real incident? Connect Atmosly read-only and run a free five-minute audit of your cluster. Start with Atmosly.