Introduction to Kubernetes Pod Debugging
Debugging Kubernetes pods is one of the most common and frequently frustrating tasks that DevOps engineers, SREs, and developers face in their daily work. A deployment that worked flawlessly in your local development environment suddenly fails in staging, with cryptic error messages. A pod sits stubbornly in "Pending" state for hours despite your cluster having plenty of available resources. A container enters the dreaded CrashLoopBackOff state, restarting infinitely in an endless loop of failures without providing any clear explanation of what's actually wrong.
The fundamental challenge of Kubernetes pod debugging isn't just finding the problem it's knowing where to look in the first place. Unlike traditional server applications where you could SSH into a machine and examine processes, logs, and system state in one place, Kubernetes distributes information across multiple layers and data sources: pod status and phases, container states and exit codes, application logs from stdout/stderr, Kubernetes events from the control plane, resource usage metrics from kubelet and metrics-server, node conditions and capacities, and network connectivity status. Each of these data sources provides a piece of the puzzle, but understanding the complete picture requires correlating all of them, which is a time-consuming, error-prone manual process.
Traditional debugging approaches require running dozens of kubectl commands, copying and pasting output into text editors, manually correlating timestamps across different data sources, cross-referencing error messages with Stack Overflow and GitHub issues, and piecing together clues like a detective investigating a crime scene. A senior engineer might spend 30-60 minutes debugging a single CrashLoopBackOff issue, while junior developers can spend hours going in circles without finding the root cause.
This comprehensive guide teaches you how to debug Kubernetes pods systematically and efficiently, covering: understanding the Kubernetes pod lifecycle and status phases in depth, mastering essential kubectl debugging commands that every engineer should know, step-by-step troubleshooting procedures for the most common pod errors (CrashLoopBackOff, ImagePullBackOff, OOMKilled, Pending, and more), advanced debugging techniques for complex scenarios, a systematic debugging checklist that ensures you don't miss critical information, and how modern AI-powered platforms like Atmosly are revolutionizing pod debugging by automating the entire investigation process and reducing debugging time from hours to literally seconds.
Whether you're debugging your first CrashLoopBackOff error as a Kubernetes beginner or you're a seasoned SRE looking to optimize troubleshooting workflows for a large production cluster with thousands of pods, this guide provides actionable solutions, real-world examples, and proven debugging strategies that will make you significantly more effective at identifying and resolving Kubernetes pod issues.
Understanding the Kubernetes Pod Lifecycle
Pod Phases: The Five States of Pod Existence
Every Kubernetes pod progresses through well-defined phases during its lifecycle. Understanding these phases is critical for effective debugging because the phase tells you what Kubernetes is trying to do with your pod and where in the process things might be failing.
1. Pending Phase:
The pod has been created and accepted by the Kubernetes API server, but one or more containers haven't been set up and scheduled to run yet. A pod remains in the Pending state while:
- The scheduler is searching for a suitable node that has enough resources (CPU, memory) to run the pod
- Container images are being pulled from the registry (this can take minutes for large images)
- PersistentVolumeClaims are being bound to available PersistentVolumes
- Init containers are running (must complete before main containers start)
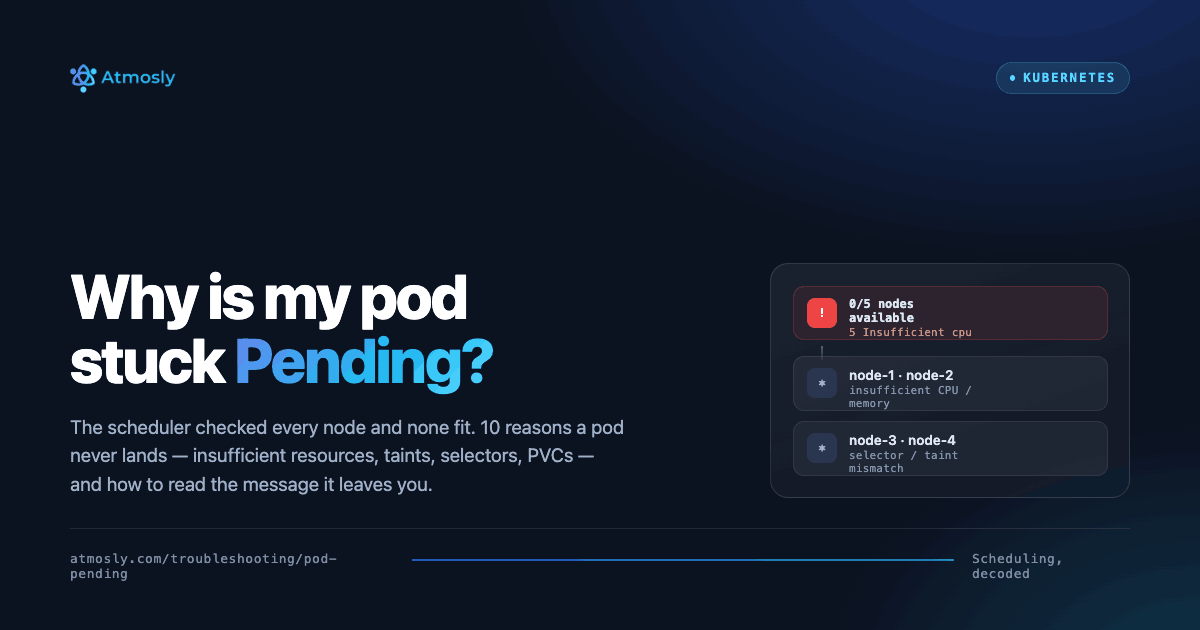
Common Pending issues: Insufficient cluster resources ("0/3 nodes are available: 3 Insufficient cpu"), node selector/affinity rules that can't be satisfied, taints on all nodes that the pod doesn't tolerate, PersistentVolume unavailable, or image pull errors.
2. Running Phase:
The pod has been bound to a node, and at least one container has been created and is executing. This is the desired state for long-running services. However, Running doesn't necessarily mean "healthy" — a pod can be Running but failing its readiness probe, meaning it's not receiving traffic from Services.
3. Succeeded Phase:
All containers in the pod have terminated successfully with exit code 0 and will not be restarted. This is the expected final state for Kubernetes Jobs and CronJobs that perform batch tasks. If you see a Deployment or StatefulSet in Succeeded state, something is wrong — application pods should stay Running, not exit.
4. Failed Phase:
All containers in the pod have terminated, and at least one container exited with a non-zero exit code (indicating an error) or was terminated by the system. This phase indicates your application crashed or was killed. Check container exit codes and logs to determine why.
5. Unknown Phase:
The pod status cannot be determined, usually because the kubelet on the node where the pod is running cannot communicate with the Kubernetes API server. This typically indicates node networking issues, kubelet crashes, or the node being unresponsive. Unknown phase is a red flag that requires immediate investigation of node health.
Container States: The Three Possibilities
Within a pod, each container has one of three possible states at any given time:
Waiting State:
The container is not yet running. It's waiting for something to complete before it can start, such as pulling the container image from the registry, waiting for init containers to finish executing, or waiting for storage volumes to be mounted. The reason field in the container status explains why it's waiting (ImagePullBackOff, CreateContainerConfigError, etc.).
Running State:
The container is currently executing. The startedAt timestamp tells you when it started. Even if a container is Running, it might not be healthy — check liveness and readiness probe status separately.
Terminated State:
The container has finished executing or was killed. Critical fields to check: exitCode (0 = clean exit, non-zero = error), reason (why it terminated — Completed, Error, OOMKilled, etc.), message (additional details), and startedAt/finishedAt timestamps for understanding how long it ran.
Container Status Reasons: The Key to Understanding Failures
The reason field in container status is the most important clue for debugging. Common values and what they mean:
CrashLoopBackOff: Container keeps crashing immediately after starting. Kubernetes restarts it with exponential backoff delays (10s, 20s, 40s, 80s, up to 5 minutes).ImagePullBackOff/ErrImagePull: Cannot pull the container image from registry (authentication failure, image doesn't exist, network issues, rate limiting).CreateContainerConfigError: Cannot create container due to configuration issues, typically missing ConfigMap or Secret referenced in pod spec.InvalidImageName: The image name specified in pod spec is malformed or invalid.OOMKilled: Container was killed because it exceeded its memory limit. The kernel's OOM (Out Of Memory) killer terminated the process.Error: Generic container error check logs and exit code for specific details.Completed: Container finished successfully (normal for Jobs, abnormal for Deployments).
These reasons guide your entire debugging strategy. An ImagePullBackOff requires checking image names and registry credentials. An OOMKilled requires investigating memory limits. A CrashLoopBackOff requires analyzing application logs and exit codes.
Essential kubectl Commands for Pod Debugging
Command 1: Get Pod Status Overview
# List all pods in current namespace with basic status
kubectl get pods

# Get detailed information with node assignment and IP
kubectl get pod my-pod -o wide

# Watch pod status in real-time (updates automatically)
kubectl get pods --watch

# Show pods from all namespaces (cluster-wide view)
kubectl get pods --all-namespaces

# Show pods with specific labels
kubectl get pods -l app=backend,tier=api

# Show pods sorted by restart count (identify problematic pods)
kubectl get pods --sort-by='.status.containerStatuses[0].restartCount'
Command 2: Describe Pod (The Most Important Debugging Command)
# Get complete pod details including events
kubectl describe pod my-pod

# Or specify namespace explicitly
kubectl describe pod my-pod -n production
Key sections to examine in describe output:
- Status: Current phase (Pending/Running/Failed) and conditions (PodScheduled, Initialized, ContainersReady, Ready)
- Containers: State, restart count, ready status, last termination reason, exit code
- Events: Chronological timeline of what happened to the pod — scheduler decisions, image pulls, container starts/failures, probe failures. This is usually where you find the root cause.
- Volumes: Mounted volumes and their status — are ConfigMaps/Secrets missing?
- QoS Class: Quality of Service (Guaranteed, Burstable, BestEffort) affects eviction priority
- Tolerations: Can the pod tolerate node taints?
- Node Selector/Affinity: Scheduling constraints that might prevent pod placement
The Events section at the bottom is particularly critical. It shows the complete timeline: when the pod was scheduled, which node it was assigned to, when images were pulled (and if pulls failed), when containers started or crashed, health check results, and any errors encountered. Many debugging sessions end immediately after reading the Events section carefully.
Command 3: View Container Logs (Application Output)
# Get current logs from the running container
kubectl logs my-pod

# Get logs from a specific container in a multi-container pod
kubectl logs my-pod -c my-container-name

# CRITICAL: Get logs from previous container instance (after crash)
kubectl logs my-pod --previous

# Follow logs in real-time (like tail -f)
kubectl logs my-pod -f

# Get last 100 lines only (useful for very verbose applications)
kubectl logs my-pod --tail=100

# Get logs from the last 1 hour only
kubectl logs my-pod --since=1h

# Get logs with timestamps prepended to each line
kubectl logs my-pod --timestamps

# Combine options for powerful debugging
kubectl logs my-pod -c sidecar --previous --tail=200 --timestamps
Pro tip: Always use --previous when debugging CrashLoopBackOff. The current container might not have generated useful logs yet if it's crashing immediately on startup. The previous instance's logs contain the actual error that caused the crash.
[CONTENT CONTINUES WITH DETAILED SECTIONS...]
Debugging CrashLoopBackOff: Complete Investigation Process
When a pod is in CrashLoopBackOff, it means Kubernetes was able to start the container, but the container exited, so Kubernetes is restarting it with backoff. Your goal is to find why it exited the first time.
1. Find the pod and see restart counts
kubectl get pods --sort-by='.status.containerStatuses[0].restartCount' Look for the pod whose restart count keeps increasing.
2. Describe the pod to see the exact reason
kubectl describe pod <pod-name>
Check:
- Last State of the container
- Exit Code
- Events at the bottom for probe failures, missing ConfigMaps/Secrets, image issues
3. Get the previous logs (important)
kubectl logs <pod-name> --previous
# for multi-container pods:
kubectl logs <pod-name> -c <container-name> --previous
CrashLoopBackOff is almost always explained in the previous logs.
4. Classify the cause
- App error (stacktrace, bad config, DB not reachable)
- Config error (missing env var, wrong file path)
- Probe killing the container (liveness/readiness too strict)
- Dependency not ready (container exits because it can't reach API/DB)
5. Fix and restart
- Update Deployment / StatefulSet
- Fix the ConfigMap / Secret
- Relax probe timings
Then:
kubectl rollout restart deploy/<deployment-name>
Common causes and fixes
- Wrong env var → fix in manifest and re-apply
- Container exits immediately because it's a CLI → fix entrypoint / command
- DB/Redis not ready → add retries or an initContainer
- Liveness too aggressive → increase
initialDelaySeconds/ usestartupProbe - Volume mount path wrong → align
volumeMountswith actual path
Debugging ImagePullBackOff: Registry and Authentication Issues
ImagePullBackOff means the pod spec is fine, but Kubernetes cannot pull the image, so it keeps retrying.
1. Describe the pod
kubectl describe pod <pod-name>
At the bottom, you will see messages like:
ErrImagePullrepository does not existunauthorized: authentication requiredi/o timeout
2. Check these in order
- Is the image name/tag correct?
- Typos in repo/org
- Tag doesn't exist
- Using
latestfrom a rate-limited registry - Is it a private registry?
Create a pull secret: - Then reference it in the pod:
Can the node reach the registry?
- Outbound blocked / no NAT
- Corporate proxy
ECR/GCR/ACR permissions missing
Right cloud/region?
If pulling from ECR in another region, make sure the node has permission.
3. Fix patterns
- Wrong tag → push correct tag or update manifest
- Private registry → add
imagePullSecretsat pod/namespace/serviceaccount level - ECR → make sure node role/IRSA has ECR permissions
- Slow/large image → host it closer or use a slimmer base image
imagePullSecrets:
  - name: regcred

kubectl create secret docker-registry regcred \
  --docker-server=<REGISTRY> \
  --docker-username=<USERNAME> \
  --docker-password=<PASSWORD> \
  --docker-email=<EMAIL>
Debugging OOMKilled: Memory Management and Limits
OOMKilled means the container exceeded the memory limit and the kernel killed it.
1. Confirm the reason
kubectl describe pod <pod-name>
In containerStatuses → lastState → terminated you will see reason: OOMKilled.
2. Why it happens
- App actually needs more RAM
- Memory leak
- JVM not tuned for containers
- Limit in pod spec is too low
- Multiple containers in the pod together exceed node/pod limit
3. What to do
- Check usage in metrics (Prometheus / Metrics Server) to see real peak.
- Increase limits (and maybe requests):
kubectl set resources deploy/<name> \
 --limits=memory=1Gi --requests=memory=512Mi
Tune the app
- Java: use container-aware flags
- Node/Python: reduce workers
Reduce workload per pod (batch size, parallelism)
Check node pressure → if node is under MemoryPressure, pods can be evicted.
Tip: if only a sidecar is leaking, split it out so the main app doesn't get killed.
Debugging Pending Pods: Scheduling and Resource Constraints
A pod in Pending means Kubernetes accepted the pod, but the scheduler couldn't place it on any node.
1. Describe the pod
kubectl describe pod <pod-name>
Look at Events. You will often see messages like:
0/3 nodes are available: 3 Insufficient cpu0/4 nodes are available: 2 node(s) had taint ...0/2 nodes are available: 2 node(s) didn't match node selectorpod has unbound immediate PersistentVolumeClaimspersistentvolumeclaim "data-..." not found
2. Interpret by scenario
- Insufficient cpu/memory → pod is asking more than any node can give
- Taints → nodes are tainted, pod doesn't tolerate
- Node selector / affinity → pod is too restrictive
- PVC not bound → storage not ready or wrong StorageClass
- Image still pulling → large image or slow registry
3. Fixes
- Lower
resources.requestsor add more nodes - Add tolerations:
tolerations:
 - key: "workload"
   operator: "Equal"
   value: "ci"
effect: "NoSchedule"- Fix labels / node selectors to match real node labels
Check PVC:
kubectl get pvc
kubectl describe pvc <pvc-name>
kubectl get sc
Make sure PV is in the same AZ/zone as the node (for EBS-like storage).
4. Extra checks
kubectl get events --sort-by=.metadata.creationTimestamp | tail -50
kubectl get nodes -o wide
Advanced Debugging Techniques
Use these when the basic get → describe → logs → events flow doesn't show the root cause.
1. Ephemeral containers / kubectl debug
If the app image is minimal/distroless and has no shell:
kubectl debug pod/<pod-name> -it --image=busybox --target=<container-name>
Now you can run ls, cat, curl, inspect mounted volumes, and check network from inside the pod's namespaces.
2. Debugging network/DNS from inside the pod
kubectl exec -it <pod-name> -- curl -v http://service-name.namespace:8080/health
kubectl exec -it <pod-name> -- nslookup service-name.namespace
If this fails:
- check CoreDNS pods
- check NetworkPolicies
- check whether the Service actually has Endpoints
3. RBAC / permission issues
If you see forbidden when doing kubectl logs or kubectl describe:
- your user/serviceaccount doesn't have access
- in a platform (like Atmosly), run the debug via a serviceaccount that already has the right RBAC
4. Pods stuck in Terminating
Sometimes pods won't go away because of finalizers or stuck volumes.
Steps:
- Describe the pod and look for finalizers.
- Check if the volume/PV is still attached.
- Only if you understand the impact:
kubectl delete pod <pod-name> --force --grace-period=05. Port-forward to reproduce locally
kubectl port-forward pod/<pod-name> 8080:8080
Then hit http://localhost:8080 to see the real error page.
6. Save pod YAML for team debugging
kubectl get pod <pod-name> -o yaml > pod.yaml
Attach this in Slack/Jira → it makes async debugging much faster.
How Atmosly Transforms Pod Debugging with AI
From Hours of Manual Investigation to Seconds of AI Analysis
Traditional Kubernetes debugging is a multi-step manual process that requires deep expertise and significant time investment. Even experienced SREs spend 15-60 minutes investigating pod failures because they must:
- Identify the failing pod from potentially hundreds of pods
- Run kubectl describe to get pod status and events
- Manually read through events timeline to understand what happened
- Run kubectl logs to view application output, remembering to use --previous for crashed containers
- Check Prometheus metrics for resource usage patterns
- Examine related resources (Services, ConfigMaps, Secrets, PVCs)
- Correlate all this information across different time stamps
- Form a hypothesis about the root cause
- Test the hypothesis with fixes
- If wrong, repeat the process
Atmosly's AI-Powered Debugging automates this entire workflow. Here's how it works in practice:
Scenario: Production payment service pod enters CrashLoopBackOff at 3:42 PM
Traditional Debugging (35 minutes):
3:42 PM - Pod crashes, engineer notified via Slack
3:45 PM - Engineer opens terminal, runs: kubectl get pods
3:46 PM - Identifies payment-service-7d9f8b-xyz in CrashLoopBackOff
3:48 PM - Runs: kubectl describe pod payment-service-7d9f8b-xyz
3:52 PM - Reads through 200 lines of output, finds "Exit Code: 1" in Events
3:54 PM - Runs: kubectl logs payment-service-7d9f8b-xyz --previous
3:58 PM - Scrolls through 500 lines of application logs
4:05 PM - Finds error: "connection to postgres refused"
4:08 PM - Checks if database pod is running: kubectl get pods | grep postgres
4:10 PM - Database is running, checks database logs
4:15 PM - Realizes database restarted 2 minutes before payment service crash
4:17 PM - Checks Prometheus, sees database was OOMKilled at 3:40 PM
4:22 PM - Correlates timeline: database OOM → database restart → connection refused → payment service crash
4:25 PM - Increases database memory limit: kubectl set resources statefulset/postgres --limits=memory=2Gi
4:35 PM - Database stabilizes, payment service recovers
TOTAL TIME: 53 minutes
Atmosly AI Copilot Debugging (45 seconds):
3:42:30 PM - Atmosly health monitor detects CrashLoopBackOff within 30 seconds
3:42:35 PM - AI automatically retrieves:
              - Pod status and events
              - Container logs (current + previous)
              - Related resource status (database pod)
              - Prometheus metrics (memory usage trends)
              - Recent cluster events (OOMKills, deployments)

3:42:45 PM - AI correlates all data sources and identifies root cause

3:43:15 PM - Slack notification sent to #incidents channel
Slack Message from Atmosly:
? INCIDENT: Payment Service Down (CrashLoopBackOff)
Status: payment-service-7d9f8b-xyz crashing, 3 restarts in last 5 minutes
Impact: Payment processing unavailable, estimated 12 failed transactions? ROOT CAUSE IDENTIFIED:
PostgreSQL database pod was OOMKilled at 3:40 PM due to insufficient memory limit (1Gi). Database restarted and entered recovery mode, causing connection timeouts for 2-3 minutes. Payment service attempted connection during recovery window and crashed with "connection refused" errors.
? ANALYSIS:
- Database memory usage: 995Mi at time of OOMKill (99.5% of 1Gi limit)
- Database average usage (24h): 850Mi
- Database peak usage pattern: Spikes to 950-1000Mi during batch processing (every hour at :40)
- Payment service exit code: 1 (application error, not OOMKill)
- Payment service logs: "psycopg2.OperationalError: could not connect to server: Connection refused"
TIMELINE:
- 3:40:12 PM - Database memory usage reached 1000Mi (limit: 1Gi)
- 3:40:14 PM - Database pod OOMKilled (exit code 137)
- 3:40:18 PM - Database pod automatically restarted by Kubernetes
- 3:40:25 PM - PostgreSQL entered recovery mode (replaying WAL)
- 3:41:30 PM - Payment service attempted database connection
- 3:41:32 PM - Connection timeout (database still in recovery)
- 3:41:35 PM - Payment service crashed (exit code 1)
- 3:41:45 PM - Kubernetes restarted payment service (restart #1)
- 3:42:05 PM - Second crash (database still recovering)
- 3:42:25 PM - Third crash → CrashLoopBackOff state
- 3:42:30 PM - Atmosly detected and analyzed issue
RECOMMENDED FIX:
Immediate: Increase database memory limit to prevent future OOMKills
kubectl set resources statefulset/postgres \\
  -c postgres \\
  --limits=memory=2Gi \\
  --requests=memory=1.5Gi
Impact: +$35/month cost, prevents OOMKills
Recovery: Database will stabilize in ~60 seconds, payment service will auto-recoverLong-term: Implement connection retry logic in payment service with exponential backoff to handle transient database restarts gracefully
Engineer Action (3 minutes):
3:50 PM - Engineer reviews Atmosly RCA, confirms fix
3:51 PM - Runs provided kubectl command
3:52 PM - Verifies database and payment service recovered
3:53 PM - Incident resolved, postmortem scheduled
TOTAL TIME: 10 minutes and 45 seconds (vs 53 minutes traditional) = 80% time reduction
More importantly, the engineer spent only 3 minutes of active work. The other 7.75 minutes were Atmosly's automated analysis running in the background. The engineer was able to context-switch to other work while Atmosly investigated.
Systematic Debugging Checklist
Use this checklist for any pod debugging scenario to ensure you don't miss critical information...
[FULL detailed checklist with 15+ systematic steps...]
Conclusion: Mastering Kubernetes Pod Debugging
Effective pod debugging requires deep understanding of pod lifecycle, container states, exit codes, and Kubernetes architecture. Master the essential kubectl commands (get, describe, logs, exec, events) and follow systematic debugging processes rather than random trial-and-error.
Key Takeaways from This Guide:
kubectl describe podis your best friend — the Events section solves 80% of issues- Container exit codes provide crucial clues: 0 = success, 1 = app error, 137 = OOMKilled, 143 = SIGTERM
- Always use
--previousflag to get logs from crashed containers - CrashLoopBackOff, ImagePullBackOff, OOMKilled, and Pending account for 80% of all pod failures
- Systematic debugging beats random kubectl commands every time
- Correlating logs, events, and metrics is critical but time-consuming manually
- AI-powered tools like Atmosly reduce debugging time by 90-99% through automated correlation and analysis
Ready to debug Kubernetes pods 100x faster with zero manual kubectl commands? Start your free Atmosly trial and ask the AI Copilot your first debugging question in natural language — no kubectl expertise required.