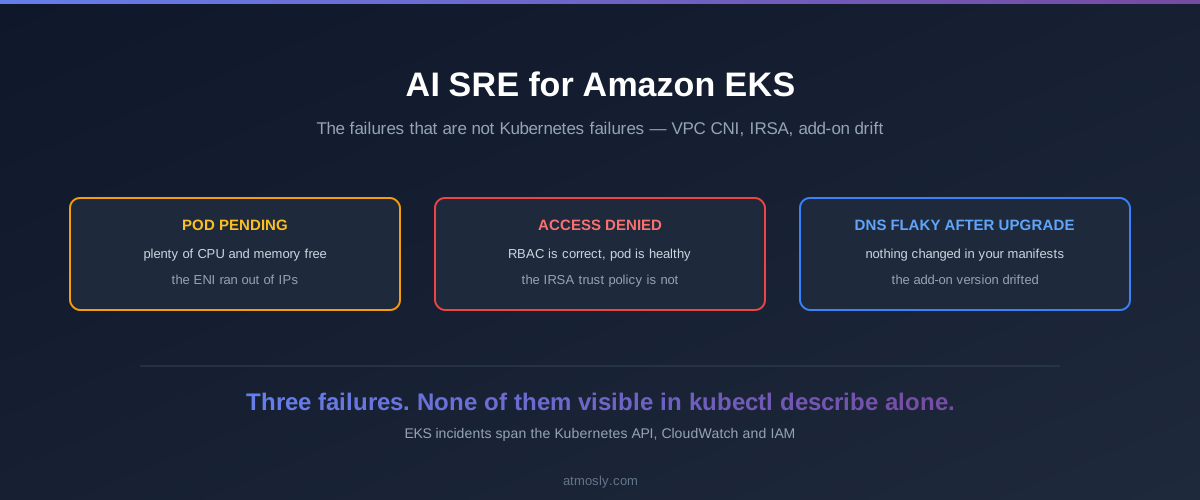
Running an AI SRE agent against Amazon EKS is different from running one against a self-managed cluster, and the difference is not the Kubernetes part. It is that a meaningful share of EKS incidents present as ordinary pod failures while their actual causes sit in AWS — in a subnet with no free IPs, an IAM trust policy that does not match, or an add-on version that drifted after a control plane upgrade.
An agent reading the Kubernetes API diagnoses the first category well and cannot see the second at all. Knowing which is which is the whole skill. This covers the EKS-specific failure modes, where the evidence actually lives, what Astra handles on EKS, and where the boundary sits.
EKS incidents span three planes
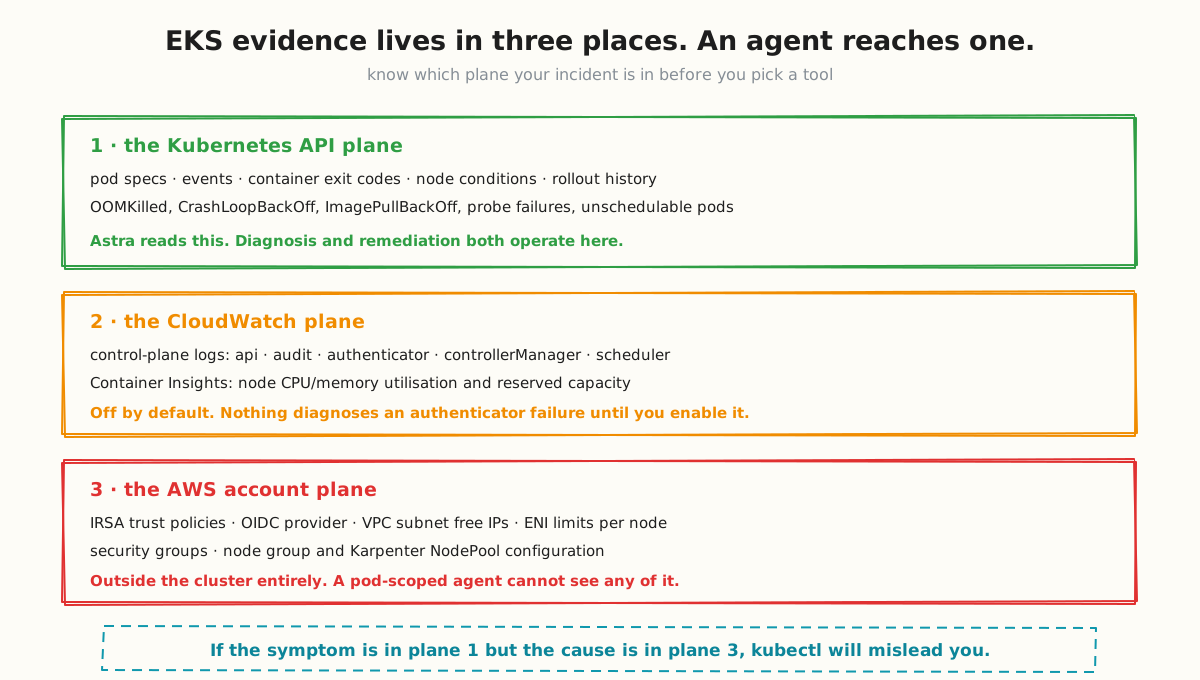
The Kubernetes API plane. Pod specs, events, container exit codes, node conditions, rollout history. Every standard failure signature lives here — OOMKilled, CrashLoopBackOff, ImagePullBackOff, probe failures, unschedulable pods. This is where an in-cluster agent operates, and it is the plane most incidents resolve in.
The CloudWatch plane. EKS control plane logs cover five types — api, audit, authenticator, controllerManager and scheduler — and they are off by default. Container Insights is separately opt-in. Nothing diagnoses an authenticator failure until you enable the log type that records it, which is a decision made months before the incident.
The AWS account plane. IRSA trust policies, the OIDC provider, free IPs in your subnets, ENI limits per instance type, security groups, node group and Karpenter NodePool configuration. All of it outside the cluster, none of it visible to a pod-scoped agent.
The failure mode to plan around: the symptom appears in plane one while the cause sits in plane three. That is where teams lose hours, because every tool pointed at the cluster keeps confirming the symptom.
The failures that are not Kubernetes failures
VPC CNI IP exhaustion
The most common EKS-only incident, and the one that misleads most reliably.
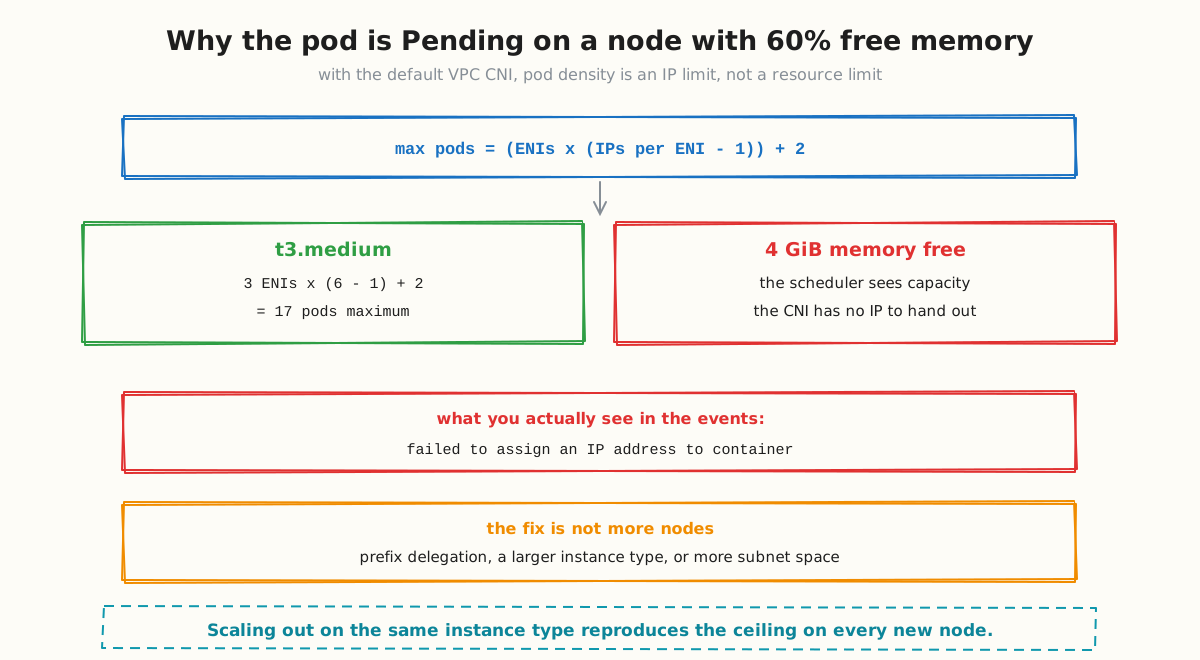
With the default Amazon VPC CNI, every pod gets a real VPC IP address from an ENI attached to the node. Pod density is therefore capped by networking, not by CPU or memory:
max_pods = (ENIs × (IPs_per_ENI − 1)) + 2

# t3.medium: 3 ENIs, 6 IPs each
#   (3 × 5) + 2 = 17 pods maximum
A t3.medium with 4 GiB of free memory will refuse an eighteenth pod. The scheduler sees capacity, the CNI has no address to hand out, and the event reads failed to assign an IP address to container.
Two traps follow. First, scaling out with the same instance type reproduces the ceiling on every new node. Second, the subnet itself can exhaust independently — nodes have ENI capacity but the subnet CIDR is full, which looks identical from inside the cluster. The real fixes are prefix delegation, a larger instance type, or more subnet space.
Find out which plane your EKS incidents live in.
Connect an EKS cluster read-only in about 5 minutes and get the live issue list. No write access, and no inbound path into your VPC.
Diagnose it directly:
# What does this node think its pod ceiling is?
kubectl get node $NODE -o jsonpath='{.status.allocatable.pods}'

# Free IPs left in the subnet
aws ec2 describe-subnets --subnet-ids $SUBNET_ID \
  --query 'Subnets[0].AvailableIpAddressCount'
IRSA trust policy mismatches
A pod is Running and healthy. RBAC is correct. The application logs an AWS AccessDenied, and nothing in Kubernetes is wrong.
IRSA maps a Kubernetes ServiceAccount to an IAM role through an OIDC provider, and it breaks in ways with no Kubernetes-side signal: the role's trust policy names a different ServiceAccount or namespace, the OIDC provider was not created for the cluster, the annotation has a typo, or the pod started before the webhook injected the token.
The diagnostic detail worth knowing is that the token is mounted into the pod, so you can inspect the mapping from inside:
kubectl exec -n $NS $POD -- env | grep AWS_ROLE_ARN
kubectl get sa $SA -n $NS -o jsonpath='{.metadata.annotations}'
aws sts get-caller-identity   # from inside the pod
An agent reading cluster state can surface the annotation and the mounted role ARN. It cannot read the IAM trust policy on the other side, so it can narrow this to "the mapping looks wrong" but not confirm which side is at fault.
Add-on version drift after a control plane upgrade
You upgrade the control plane. Nothing in your manifests changed. DNS goes intermittently flaky, or pods lose network on new nodes.
EKS managed add-ons — vpc-cni, coredns, kube-proxy, aws-ebs-csi-driver — have their own version compatibility matrix against the control plane version, and they do not upgrade with it. The symptom appears days later when a node rotates and picks up the mismatch.
aws eks describe-addon --cluster-name $CLUSTER \
  --addon-name vpc-cni --query 'addon.[addonVersion,status]'

aws eks describe-addon-versions --addon-name vpc-cni \
  --kubernetes-version 1.33 --query 'addons[0].addonVersions[0].addonVersion'
What Astra does on EKS
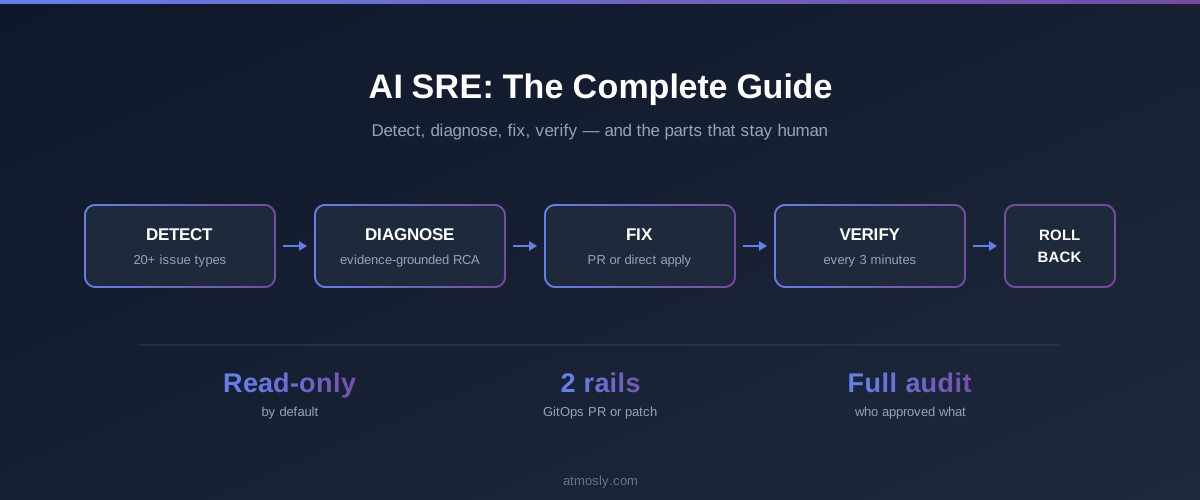
Concretely, on the Kubernetes plane: detection of 20+ issue types, evidence read off the live Pod object at detection, and remediation delivered as an ArgoCD pull request or a direct patch behind an approval gate. That covers the failures in plane one, which is most of them.
Two EKS-specific behaviours are worth calling out.
Cluster over-provisioning via Container Insights. Astra reads node_cpu_utilization, node_memory_utilization, reserved capacity, node count and running pods over a 7-day window, and flags a cluster as over-provisioned when CPU averages under 20% and memory under 30% with more than one node. The boundary: this requires Container Insights to be enabled. Without it the check records that fact and skips rather than guessing.
Node rightsizing that knows who owns the instance type. EKS nodes are EC2 instances on your bill and are included in rightsizing. Cluster identity comes from the standard tags — kubernetes.io/cluster/{name}, eks:cluster-name, eks:nodegroup-name, karpenter.sh/nodepool — and confidence is capped by who actually controls the sizing decision:
| Node type | Confidence cap | Why |
|---|---|---|
| Karpenter-managed | low | Karpenter selects the instance type; a per-node recommendation is advisory at best |
| Managed node group | medium | You control the type, but through node group configuration |
| Standalone EC2 | No cap | Direct action available |
Nodes younger than 24 hours are excluded entirely, because autoscaler churn produces metrics that mean nothing. Recommendations carry the cluster name and node group, plus a note that acting requires editing the node group or NodePool rather than resizing an instance. For the cost side, see optimizing Amazon EKS costs and EKS pricing.
What it does not reach
Stated plainly, because this is where the EKS story differs most from the generic pitch:
- No control-plane, apiserver or etcd health detection. On EKS the control plane is AWS-managed, so this matters less than on self-managed clusters — but it means authenticator and API-level failures are not detected.
- No IAM or IRSA validation. The trust policy is outside the cluster.
- No subnet or ENI capacity awareness. It sees the pod is unschedulable; it does not know your subnet is out of addresses.
- No add-on version checking. Drift is invisible from the Kubernetes API.
- No certificate expiry detection.
- GitOps detection is ArgoCD-only. Flux-managed workloads get no sync-pause protection.
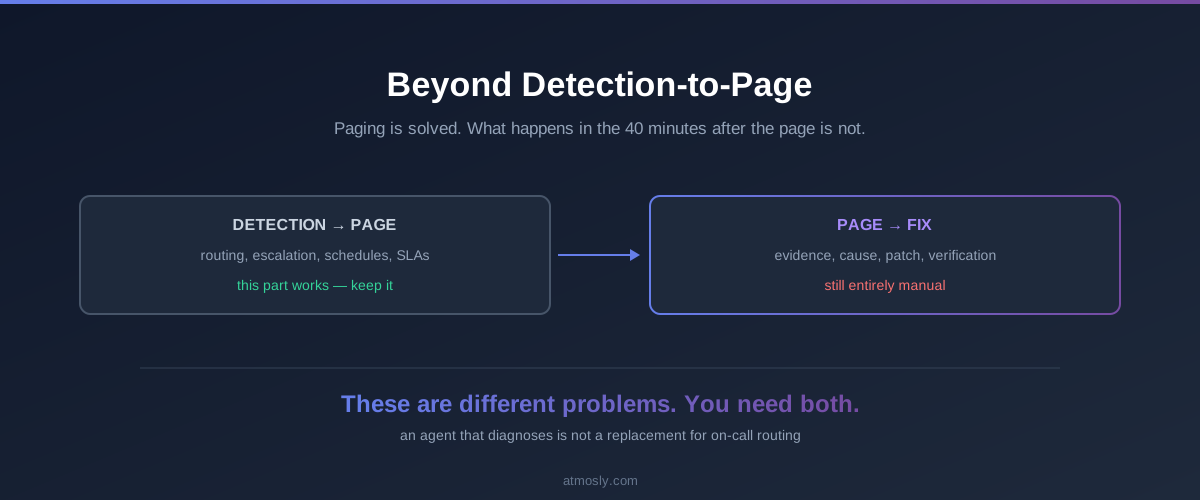
The practical read: an agent shortens the plane-one incidents, which are the frequent ones. The plane-three incidents stay manual, and they are the ones where knowing the failure modes above saves the most time.
Connecting an EKS cluster
Two paths depending on network topology. A cluster with a reachable API endpoint connects directly. A private cluster runs an in-cluster agent that dials out over WebSocket, so no inbound path into your VPC is required — which is usually the deciding factor for regulated environments.
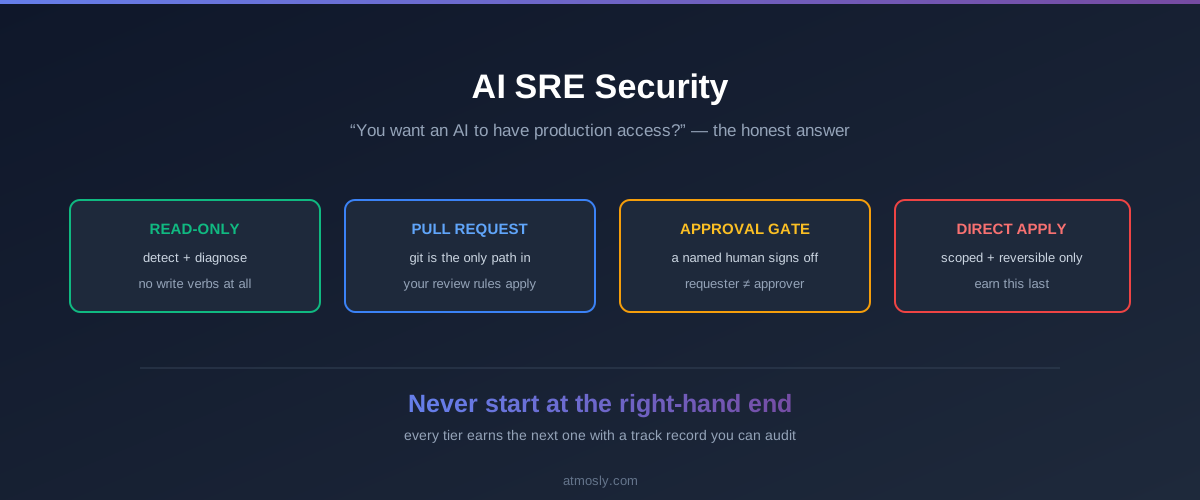
Start read-only. The detection agent needs get, list and watch plus pods/log, and nothing else. Verify what was actually granted rather than trusting the chart:
kubectl auth can-i --list \
  --as=system:serviceaccount:atmosly-system:sre-agent-read
Enable the control plane log types you will actually need before you need them — audit and authenticator are the two that matter for incidents, and they cost CloudWatch ingest, so enable deliberately rather than all five by default. AI SRE security covers the full permission model.
A short EKS-specific checklist
- Know your pod ceiling per instance type before you hit it. If you run many small pods, evaluate prefix delegation early rather than during an incident.
- Enable
auditandauthenticatorcontrol plane logs. They are the difference between diagnosing an access failure and guessing at one. - Pin and review add-on versions against your control plane version as part of every upgrade, not after.
- Tag nodes consistently. Cluster and node group attribution depends on it, for both diagnosis and cost.
- Decide where rightsizing recommendations land — with Karpenter they are NodePool edits, not instance changes.
For how the detection, diagnosis and verification loop works in general, see AI SRE for Kubernetes.
You can point an agent at an EKS cluster read-only and see which plane your recurring incidents actually live in — Atmosly Astra needs no write access to do it, and you can connect a cluster free.