Most teams start shopping for Kubernetes cost optimization tools after the same conversation. Finance asks why the cluster bill went up 40% when traffic didn't, and nobody on the platform team can answer with a number. The Grafana dashboard shows CPU sitting in single digits. The invoice says otherwise. Somewhere between those two facts is a lot of money, and no obvious owner.
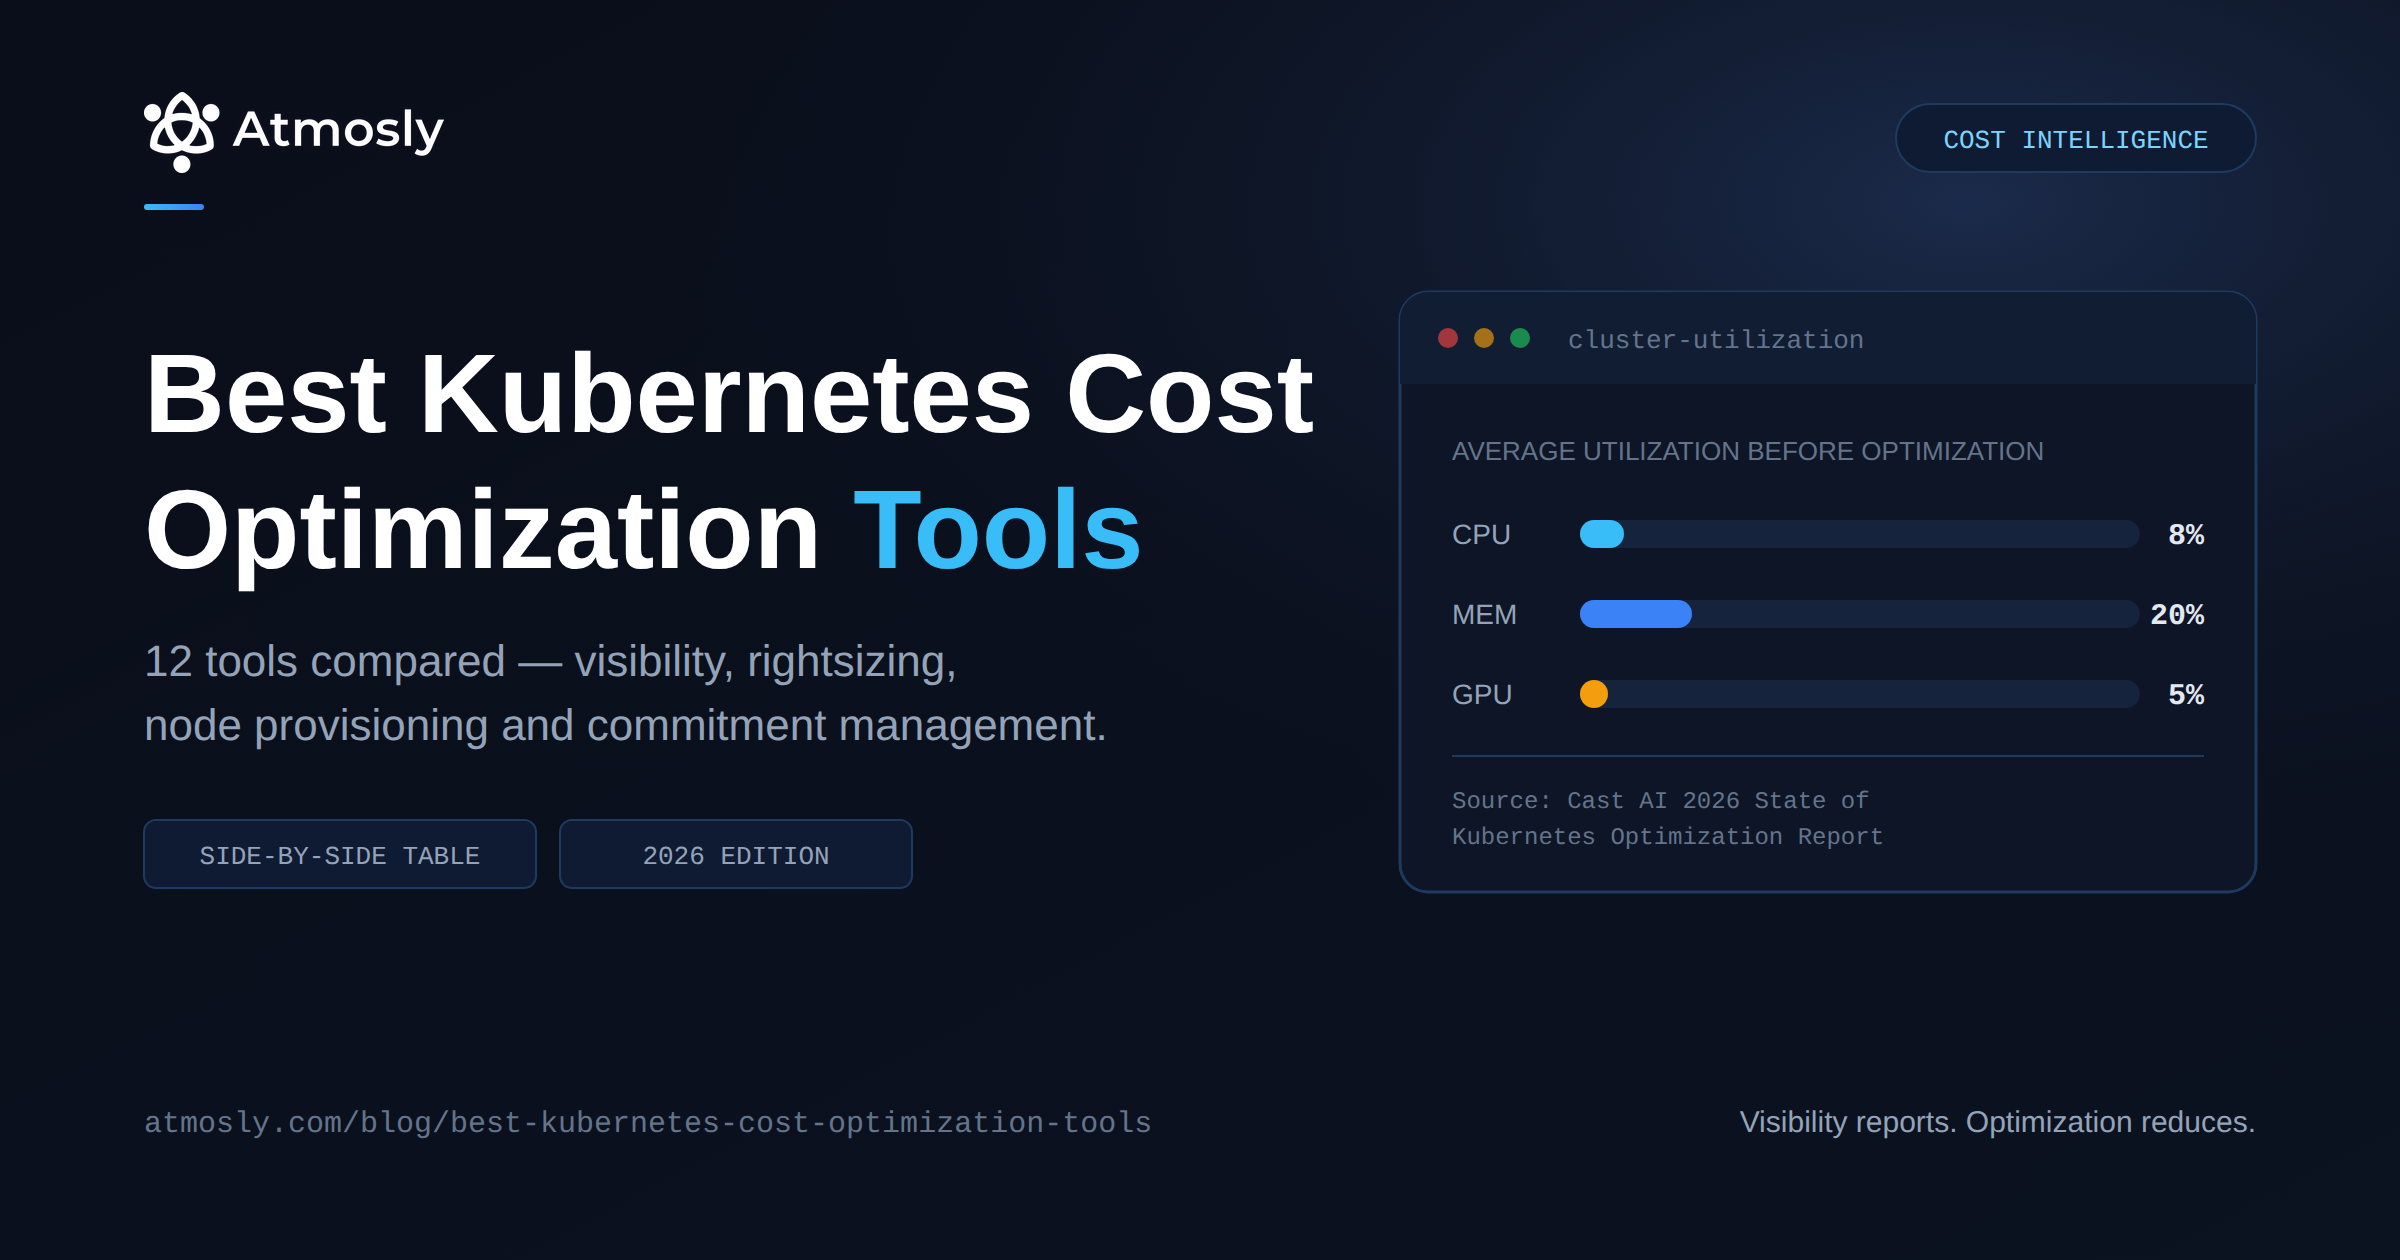
The scale of that gap is now well documented. According to Cast AI's 2026 State of Kubernetes Optimization Report, drawn from tens of thousands of production clusters, average CPU utilization sits at 8%, memory at 20%, and GPU at just 5%. CPU overprovisioning rose from 40% to 69% year over year and memory overprovisioning sits at 79%. Organizations provision roughly 12x more CPU than their workloads consume at peak.
This guide compares the 12 best Kubernetes cost optimization tools for 2026 that address that problem — what each one actually does, how much work it is to adopt, and where it stops being the right answer. Some of these report on waste. Some fix it. Knowing which is which is the entire decision.
(Disclosure: Atmosly is our product. It appears in the table on the same terms as everything else, and there are several categories below where it isn't the right recommendation — those are named explicitly.)
Kubernetes Cost Optimization Tools Compared
Start here. The most useful filter is not features or pricing — it's what a tool does when it finds waste: report it, recommend a change, or apply one.
| Tool | Primary job | Acts or reports? | Licence | Best for |
|---|---|---|---|---|
| Atmosly | All four layers + AI SRE + security, one control plane | Pods applied via GitOps PR; nodes & spot recommended | Commercial (free tier) | Seeing every layer at once, and making pod fixes stick |
| OpenCost | Cost visibility & allocation | Reports | Open source (CNCF) | A free, vendor-neutral allocation baseline |
| Kubecost (IBM) | Cost visibility & allocation | Reports + recommends | Commercial (free tier) | OpenCost with a supported UI and retention |
| CloudZero | Cost intelligence, unit economics | Reports | Commercial | Cost-per-customer and finance reporting |
| Goldilocks | Rightsizing recommendations | Recommends | Open source | A free first look at how oversized you are |
| StormForge (CloudBolt) | ML workload rightsizing | Acts | Commercial | Bursty workloads where naive VPA breaks things |
| ScaleOps | Continuous automated rightsizing | Acts | Commercial | Hands-off, real-time pod rightsizing |
| Densify | Rightsizing + instance selection | Recommends | Commercial | Mixed estates (Kubernetes plus VMs) |
| CAST AI | Full cluster automation | Acts | Commercial | Node-layer waste, spot adoption, bin-packing |
| Karpenter | Node provisioning & consolidation | Acts | Open source (CNCF) | Replacing Cluster Autoscaler on AWS |
| Zesty | Commitment & capacity automation | Acts | Commercial | RI/Savings Plan coverage and disk waste |
| AWS Compute Optimizer | Instance rightsizing | Recommends | Free (AWS) | An AWS-native starting point, zero install |
If you take one thing from that table: a dashboard has never reclaimed a core. Visibility tools will tell you the cluster runs at 8% CPU. Something else has to change the numbers in your manifests, and that something is a different category of product with a different risk profile. The best Kubernetes cost optimizers are the ones in the "Acts" column, but acting carries risk that reporting does not, which is why the rest of this guide spends as much time on guardrails as on savings.
The five-minute version
- No idea where the money goes? Start with OpenCost. It's free and it answers the attribution question.
- Know your pods are oversized? Goldilocks to measure it free, then StormForge, ScaleOps or Atmosly to fix it at scale.
- Nodes half-empty or all on-demand? Karpenter first (free), CAST AI if you want it fully automated across clouds.
- Finance asking cost-per-customer? CloudZero.
- Running ArgoCD or Flux? Check how any tool applies changes before you buy — this is where most evaluations go wrong.
The Four Layers of Kubernetes Waste
"Kubernetes costs too much" is four separate problems wearing one coat. Tools are usually excellent at one layer and irrelevant at the others, which is why comparisons that rank everything on a single axis mislead you. Effective Kubernetes optimization means identifying which layer is bleeding the most before choosing anything.
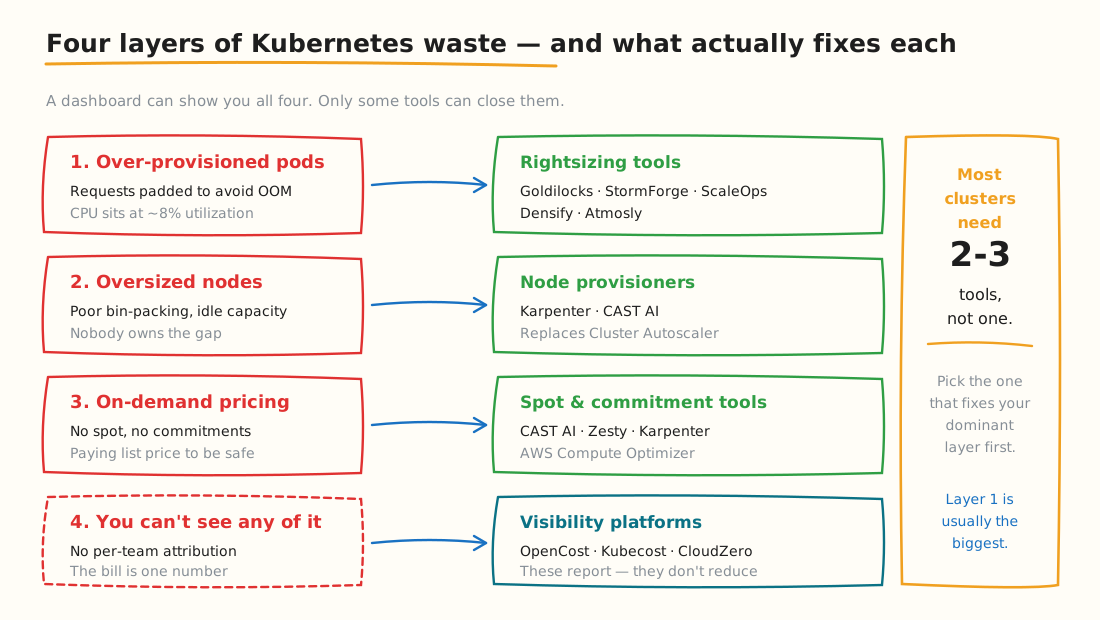
Most production clusters end up running two or three tools across different layers — not one tool that claims to do everything.
Layer 1 — Over-provisioned pods
Requests padded far above real usage, usually because someone got paged for an OOMKill once and doubled the memory request to make it stop. Nobody ever revisits it. Helm chart defaults compound the problem across every service that ships with conservative estimates.
This is typically the largest single bucket and the one with the least political resistance to fixing, because the change is contained to a manifest. It's also the layer where the utilization statistics come from — 8% CPU means requests are roughly 12x reality.
Layer 2 — Oversized or badly packed nodes
The cluster autoscaler treats inflated requests as genuine demand and provisions hardware to match. You end up paying for nodes sized against fiction.
The important dependency: fixing Layer 1 without Layer 2 doesn't save you money. Right-sized pods on the same oversized nodes just means more headroom you're still paying for. You need something that consolidates workloads onto fewer nodes and terminates the empties.
Layer 3 — Paying list price
No spot capacity, no commitment coverage, everything on-demand because spot interruptions are scary and Savings Plans require a forecast nobody wants to own.
Cast AI's benchmark found clusters partially using spot cut compute cost by an average of 59%, and fully spot-based clusters by 77%. Those figures come from a vendor whose product automates spot adoption, so treat them as a directional ceiling rather than a forecast for your cluster — but the direction is real, and the gap between on-demand and spot pricing is not marketing.
Layer 4 — No attribution
The bill is one number. Nobody can say what the checkout service costs, so nobody owns reducing it.
Connect a cluster — read-only — and see how much you can save.
Free Kubernetes cost scan. Nothing changes in your cluster.
This layer is different from the other three: it doesn't save money directly. It's the prerequisite that makes the other three fixable, because without per-team numbers there's no accountability and no way to prioritize. Teams that skip it tend to optimize whatever is most visible rather than whatever is most expensive.
Scoring your own cluster first
Before shortlisting anything, work out which layer dominates. These commands give you a rough read in about ten minutes:
# Layer 1 signal — requests vs actual usage across the cluster
kubectl get pods --all-namespaces -o custom-columns=\
'NS:.metadata.namespace,POD:.metadata.name,CPU_REQ:.spec.containers[*].resources.requests.cpu,MEM_REQ:.spec.containers[*].resources.requests.memory'

kubectl top pods --all-namespaces --sum

# Layer 2 signal — how much of each node is actually allocated
kubectl describe nodes | grep -A 5 "Allocated resources"

# Layer 3 signal — what capacity type are you running?
kubectl get nodes -L karpenter.sh/capacity-type,eks.amazonaws.com/capacityType,node.kubernetes.io/instance-type

# Layer 4 signal — do you have any cost labels at all?
kubectl get ns -o json | jq '.items[] | {name:.metadata.name, labels:.metadata.labels}'
Compare what you find against the 8% CPU / 20% memory benchmark. If you're materially better than that, your opportunity is smaller than the vendor decks suggest — which is useful to know before signing anything.
How Kubernetes Cost Attribution Actually Works
Every tool in the visibility category solves the same underlying problem, and it is harder than it looks. Your cloud bill arrives as a list of EC2 instances, EBS volumes and load balancers. Kubernetes bills nothing — it schedules pods onto nodes you already pay for. Turning one into the other is a modelling exercise, and different tools model it differently enough to produce genuinely different numbers for the same cluster.
Request vs usage — and why max() is the honest answer
A pod requests 2 CPU and uses 0.4. What did it cost?
- Charge by request and you reflect what the scheduler reserved — capacity nobody else could use. Fair for chargeback, but a team can look expensive while consuming nothing.
- Charge by usage and you reflect real consumption — but the difference has to go somewhere, or your numbers stop reconciling to the bill.
- Charge by max(request, usage) is what most mature implementations use. A pod requesting 2 and using 0.4 is charged 2, because it held 2. A pod requesting nothing and burning 3 is charged 3.
Whichever model a tool picks, ask which one it is. Two tools using different models will disagree about the same namespace and both will be internally consistent.
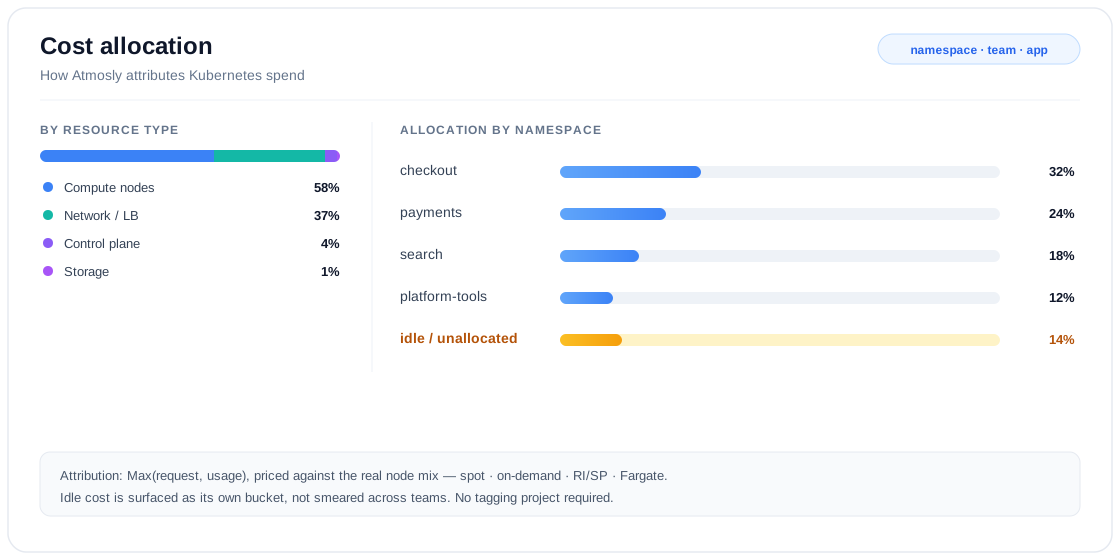
Spend broken down by resource type and attributed per namespace — with idle capacity surfaced as its own bucket rather than smeared across teams.
Idle cost: the number nobody wants to own
Node capacity minus allocated capacity is idle. It is real money — you pay for the whole node — and it belongs to nobody in particular. There are two ways to handle it, and the choice matters more than most teams realise.
- Smear it proportionally across teams. Chargeback reconciles neatly to the bill, but a team that right-sizes perfectly still gets billed for the platform's over-provisioning — which destroys the incentive you were trying to create.
- Surface it as its own bucket. Teams see their real consumption and idle appears as a platform-owned line. Less tidy, but it puts the waste in front of the people who can actually fix it.
Shared costs
The control plane, load balancers, monitoring stack, ingress controllers and system DaemonSets serve everyone. Tools differ on whether they distribute these by namespace resource share, split them evenly, or leave them unallocated. None of those is wrong — but all three produce different per-team numbers from identical infrastructure.
Rate accuracy
The last variable is what you actually pay per hour. A node on a three-year Savings Plan costs a fraction of list price. Spot nodes vary hour to hour. Tools pricing against public list rates will overstate your cluster cost, sometimes substantially. Tools that reconcile against your real bill — CUR on AWS, equivalent exports elsewhere — reflect enterprise discounts and commitment coverage.
The practical implication: before comparing two tools' savings estimates, confirm they use the same attribution model, idle treatment and rate source. Otherwise you are comparing arithmetic, not accuracy.
The Gap Underneath All Four Layers
Before the categories, one thing worth naming — because it applies to every layer above, and it's where most cost projects quietly die.
Identifying waste is the easy half. A change still has to be written into a manifest, reviewed, merged and kept. At twenty workloads someone does that by hand. At four hundred, recommendations accumulate until the backlog is intimidating enough to ignore. And in a cluster running ArgoCD or Flux there's a worse failure that looks like success: someone applies the change to the live workload, pods restart with the new limits, everyone moves on — then the next sync restores the manifest value and the saving silently disappears.
You can have perfect visibility at all four layers and still see nothing change on the invoice. This is the real case for automated Kubernetes cost optimization: not that machines size workloads better than engineers, but that the change actually gets applied and stays applied.
Atmosly
Atmosly is built around closing that gap. It attributes cost per namespace and workload, recommends right-sizing from real usage, and then opens the change as a GitOps pull request — the only form of the change that survives a sync.
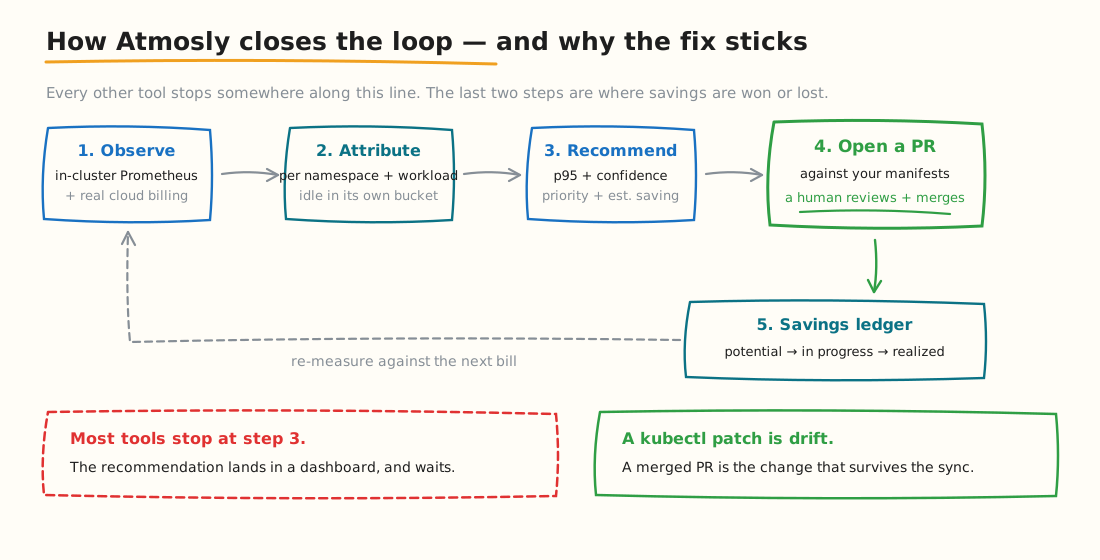
Most tools stop at step 3 — the recommendation lands in a dashboard and waits. The last two steps are where savings are actually won.
How the numbers are built. Live usage from in-cluster Prometheus is reconciled against connected cloud billing, so figures are actual costs rather than list-price estimates. Three details differ from most tools in this guide:
- Allocation uses max(request, usage) against your real node mix — spot, on-demand and commitment-covered rates priced separately — with no tagging project required to produce per-namespace numbers.
- Idle capacity is surfaced as its own bucket rather than smeared across teams, which matters when you're asking a team to justify spend they didn't cause.
- Every recommendation carries confidence, priority and an estimated saving, tracked from potential through in-progress to realized in a savings ledger — the only honest way to answer "did this actually work."
All four layers in one console. The waste layers above aren't split across separate products here. Per-workload right-sizing comes from p95 usage with confidence and priority attached. Per-nodegroup bin-packing shows requests against allocatable, and flags an over-provisioned nodegroup with a specific cheaper instance type that still fits the load with headroom. Spot eligibility is checked against live spot pricing on your current on-demand nodes, with the monthly delta attached. Allocation covers namespace, workload and resource type — compute, control plane, storage and load balancers priced separately. Well-utilised nodegroups are marked healthy rather than padded with busywork recommendations.
Where the line sits — and it's a real one. For pod right-sizing, Atmosly writes the change as a pull request. For nodes and spot, it surfaces the opportunity with the saving attached and a human acts on it — it does not replace your cluster autoscaler or manage spot interruptions in real time the way CAST AI does. That's breadth of visibility with a human in the loop, not autonomous control of your compute layer. Which of those you want is a genuine decision, not a feature gap.
Guardrails. Connection is read-only by default and every action is reversible. CPU throttle and OOM guards exist specifically to stop a cost cut degrading performance, and direct apply is available with a time-boxed sync-pause and revert window when you want speed over review.
Beyond cost. Cost Intelligence is one module on a control plane that also carries Astra, an AI SRE agent, always-on live-cluster security scanning, and CI/CD with ephemeral environments. Capabilities switch on one at a time and it runs alongside existing tooling — so adopting it for cost doesn't mean ripping anything out.
Best fit: GitOps-managed clusters where the durability of a change matters as much as the quality of the recommendation, and teams who want cost, incidents and security posture connected rather than sitting in three tools that don't talk to each other. Most customers save 20–40% on Kubernetes costs within the first three months — a range across a customer base, not a guarantee for your cluster, which is why the read-only audit exists rather than a savings calculator.
The rest of this guide covers the eleven other tools, grouped by the layer each one addresses.
Category 1: Cost Visibility and Allocation
These tools answer "where does the money go." They do not reduce spend on their own, and any vendor implying otherwise is overselling. They are, however, the layer that makes everything else prioritizable.
1. OpenCost
OpenCost is the CNCF-hosted open-source specification and implementation for Kubernetes cost monitoring. It's the vendor-neutral baseline the rest of this category is measured against — Kubecost is built on it, and several commercial platforms ingest its output rather than reimplementing allocation.
How it works. OpenCost scrapes resource usage from the cluster, joins it against cloud provider billing rates, and allocates spend by namespace, deployment, service, label, pod and container. It exposes everything through a REST API and Prometheus metrics, so you can build whatever reporting layer you want on top.
helm repo add opencost https://opencost.github.io/opencost-helm-chart
helm repo update
helm install opencost opencost/opencost \
  --namespace opencost --create-namespace

# Allocation for the last 7 days, grouped by namespace
kubectl port-forward --namespace opencost service/opencost 9003:9003 &
curl "http://localhost:9003/allocation/compute?window=7d&aggregate=namespace" | jq

# Same query grouped by a team label, for chargeback
curl "http://localhost:9003/allocation/compute?window=30d&aggregate=label:team" | jq
Adoption friction: low to install, higher to operate. You need Prometheus, and for anything beyond short windows you need long-term metric storage that you scale, back up and upgrade yourself.
Where it wins: genuinely free, no lock-in at the data layer, and good enough for real allocation work. If the question is "what does the payments namespace cost," OpenCost answers it without a procurement cycle.
Where it stops: it reports. No rightsizing automation, no node optimization, no alerting worth the name, and the UI is basic. You own the operational burden of the metrics stack underneath it.
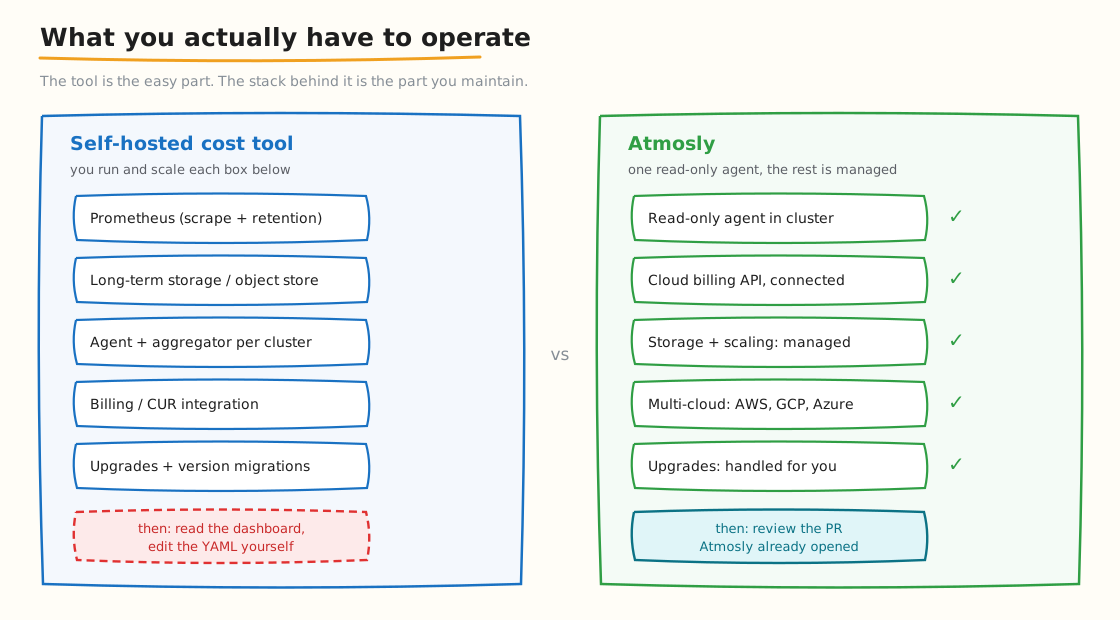
The hidden cost of free: a self-hosted stack means you run Prometheus, long-term storage, the aggregator and the billing integration — and upgrade all of it.
Pick it if: you want a defensible cost baseline before spending money on cost tooling — which is a sensible order of operations.
2. Kubecost (now part of IBM)
Kubecost is the commercial layer over OpenCost: supported UI, longer retention, multi-cluster views, alerting, budgets and savings recommendations. There's a free tier covering a single cluster with limited retention, which is a reasonable way to evaluate it.
How it works. Same allocation engine as OpenCost, plus reconciliation against actual cloud bills (including reserved instance and Savings Plan rates), shared-cost distribution, and idle cost handling. Its allocation model is the most mature in the category and notably doesn't require perfect tagging hygiene to produce usable numbers — a real advantage over generic cloud cost tools.
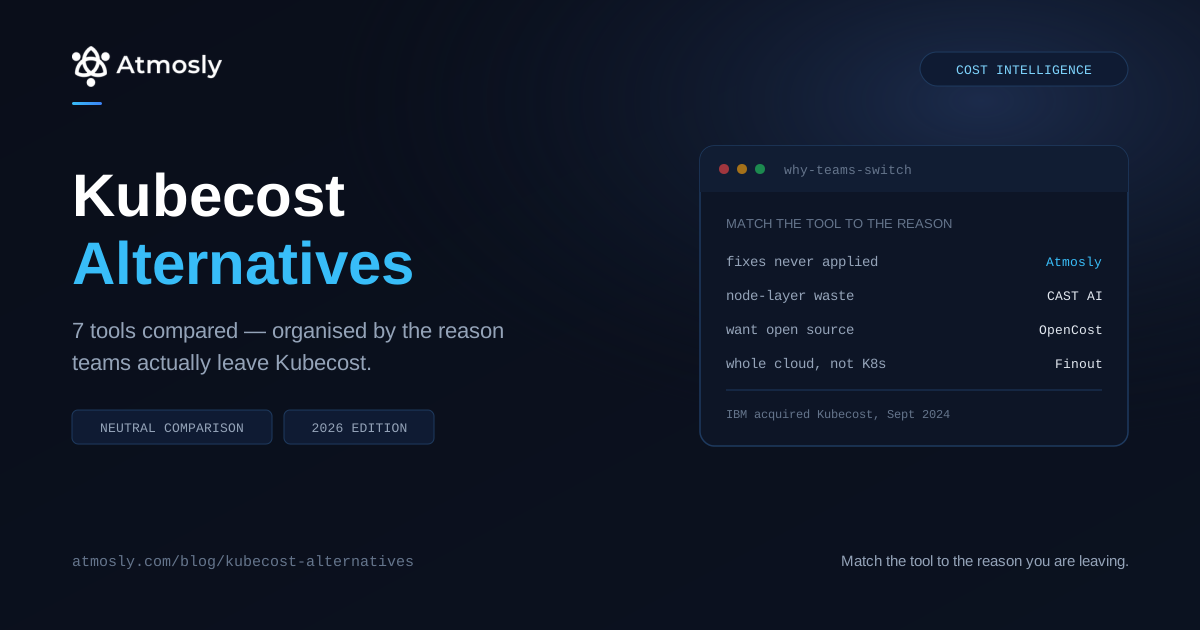
The IBM question. IBM acquired Kubecost in September 2024, folding it into the IBM FinOps Suite alongside Cloudability and Turbonomic. This matters for a multi-year decision. Some teams read it as enterprise durability and long-term investment; others have used it as a prompt to re-evaluate before renewal. Both readings are defensible. It is, empirically, the most common reason teams start searching for alternatives in this category.
Adoption friction: moderate. Helm install, then configuration for cloud billing integration and multi-cluster aggregation.
# Kubecost allocation API — cost by namespace over 30 days, idle NOT shared
kubectl port-forward --namespace kubecost deployment/kubecost-cost-analyzer 9090 &

curl "http://localhost:9090/model/allocation?window=30d&aggregate=namespace&shareIdle=false&accumulate=true" \
  | jq '.data[] | to_entries[] | {ns:.key, cpu:.value.cpuCost, ram:.value.ramCost, total:.value.totalCost}'

# Same window with idle shared proportionally — compare the two
curl "http://localhost:9090/model/allocation?window=30d&aggregate=namespace&shareIdle=true&accumulate=true" | jq
Running that query with shareIdle=false and then shareIdle=true is the fastest way to see how much of your cluster cost is idle capacity rather than team consumption. If the two results differ wildly, your problem is Layer 2, not Layer 1.
Where it wins: the deepest allocation model available, strong chargeback and showback support, and a mature product with real enterprise deployments behind it.
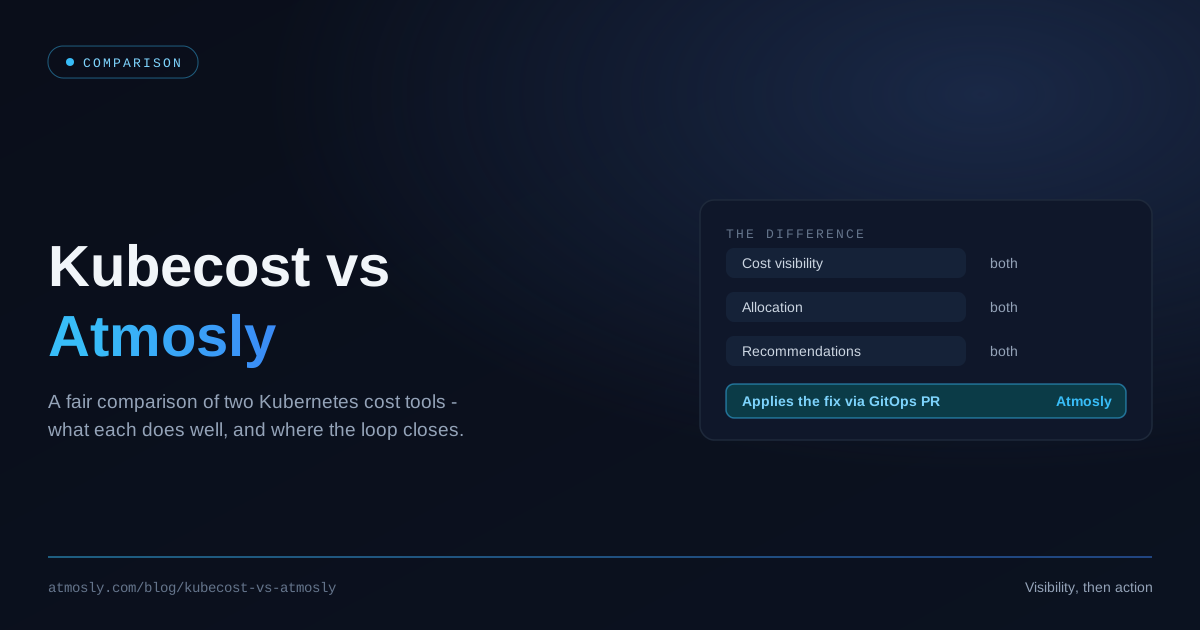
Where it stops: its rightsizing output is guidance. Applying it safely and repeatedly across hundreds of workloads means adding a second tool or building automation yourself. If you're weighing this specifically, we've written a direct Kubecost vs Atmosly comparison and maintain an Atmosly vs Kubecost page.
Pick it if: allocation and chargeback are your priority and you want a supported product rather than an open-source project you operate.
3. CloudZero
CloudZero approaches the problem from finance rather than from the cluster. Its distinguishing capability is unit economics — cost per customer, per feature, per product line — across your entire cloud estate rather than only Kubernetes.
How it works. It ingests billing data across cloud providers and SaaS spend, then maps it to business dimensions you define. Kubernetes is one input among many rather than the centre of the model.
Adoption friction: low technically (billing integrations, not cluster agents), higher organizationally — the value comes from defining meaningful business dimensions, which is a cross-team exercise.
Where it wins: when the question you're being asked is "what does it cost us to serve this customer" or "what's our gross margin per product tier," CloudZero answers it better than any Kubernetes-native tool. For a SaaS business where infrastructure is a gross margin line, that framing is worth a lot.
Where it stops: it's a reporting and intelligence platform. It will not rightsize a workload, reconfigure a node group, or change anything in your cluster. Engineering teams pair it with something that acts.
Pick it if: your cost conversation is happening with a CFO rather than a platform team.
Category 2: Workload Rightsizing
Layer 1 — usually the largest and most tractable bucket. This is where the difference between "recommends" and "acts" matters most, and where reliability risk is real. It is also where automated Kubernetes cost optimization has matured fastest, with tools ranging from recommendation-only to fully autonomous controllers.
4. Goldilocks
Goldilocks from Fairwinds is a lightweight open-source dashboard over the Kubernetes Vertical Pod Autoscaler. It runs VPA in recommendation mode and shows you, per workload, what your requests and limits arguably should be.
# VPA must be installed in the cluster first
helm repo add fairwinds-stable https://charts.fairwinds.com/stable
helm install goldilocks fairwinds-stable/goldilocks \
  --namespace goldilocks --create-namespace

# Opt a namespace in — Goldilocks creates VPA objects for its workloads
kubectl label ns production goldilocks.fairwinds.com/enabled=true

kubectl -n goldilocks port-forward svc/goldilocks-dashboard 8080:80
Adoption friction: very low. Two Helm installs and a namespace label. You'll have numbers within a day, meaningful ones within a week.
# Or skip the dashboard and run VPA directly in recommendation-only mode
apiVersion: autoscaling.k8s.io/v1
kind: VerticalPodAutoscaler
metadata:
  name: checkout-vpa
spec:
  targetRef:
    apiVersion: apps/v1
    kind: Deployment
    name: checkout
  updatePolicy:
    updateMode: "Off"      # recommend only — never evicts a pod

# Then: kubectl describe vpa checkout-vpa
#   Target:       cpu: 240m   memory: 512Mi
#   Lower Bound:  cpu: 180m   memory: 384Mi
#   Upper Bound:  cpu: 890m   memory: 1200Mi
The three bounds matter. Target is the recommendation, Lower Bound is the minimum VPA considers safe, and Upper Bound reflects observed peaks. A wide gap between Target and Upper Bound means a bursty workload — precisely the case where applying the Target naively causes OOM kills.
Where it wins: free, fast, and gives an honest first answer to "how oversized are we?" It is the cheapest possible way to size the opportunity before anyone signs a contract. Every evaluation in this category should start here, including evaluations that end with buying something else.
Where it stops: recommendations only. VPA's underlying model is simpler than the commercial engines — it doesn't reason well about bursty or seasonal workloads, and it produces one recommendation rather than a confidence-scored range. Every change is applied by hand.
Pick it if: you're at the start of this and want data before you want a vendor.
5. StormForge (CloudBolt)
StormForge builds a per-workload machine-learning model from observed utilization — typically weeks of data — capturing daily cycles, weekly patterns and burst behaviour rather than applying one percentile uniformly. CloudBolt acquired it in March 2025 and integrated it into their broader FinOps platform.
The detail that matters. StormForge adjusts resource requests and HPA target utilization as a coupled pair. This is a genuinely under-appreciated failure mode: shrink pod requests without adjusting the horizontal autoscaler's target, and your HPA starts scaling on a different effective threshold than you intended. Most rightsizing tools ignore this.
Adoption friction: moderate. It needs an observation window before recommendations are trustworthy, which is a feature rather than a delay — a tool that gives you confident numbers on day one is guessing.
Where it wins: workloads with irregular traffic where a naive p95 recommendation would cause OOM kills or throttling. If you've tried VPA and been burned, this category exists because of that experience.
Where it stops: focused on rightsizing. You'll still need something for allocation reporting and something for the node layer. The CloudBolt acquisition means it's now part of a broader platform, which is either convenient or scope you don't want depending on your situation.
Pick it if: rightsizing is your dominant layer and reliability risk is the thing blocking you from acting on it.
6. ScaleOps
ScaleOps targets continuous, automated pod rightsizing that reacts in near real time rather than on a recommendation cycle, with guardrails intended to address the reliability concerns that make teams distrust automation.
How it works. A controller in the cluster adjusts workload resources continuously based on live consumption patterns, rather than producing a recommendation for a human to apply later.
Adoption friction: low to install, but the governance conversation is the real cost. You are granting a controller authority to change production workload specs.
Where it wins: teams that want the rightsizing loop genuinely closed, with no human in it, and who are organizationally comfortable with that. At sufficient scale, manual application simply doesn't happen — a tool that acts is the only thing that produces savings.
Where it stops: that same automation is the trade-off. If your organization requires every production change to arrive as a reviewable diff with an approver, a continuously-acting controller is a policy conversation before it's a technical evaluation. It also doesn't address allocation or the node layer.
Pick it if: you have hundreds of workloads, manual rightsizing has already failed, and you can get sign-off on autonomous action.
7. Densify
Densify spans containers and virtual machines, matching workload patterns to both container resource specs and the right underlying instance types. It's the most enterprise-shaped tool in this list.
How it works. Analytics over historical utilization produce recommendations at both the container and infrastructure layer, with integrations that push those recommendations into CI/CD and IaC workflows rather than applying them directly.
Adoption friction: higher. Enterprise sales cycle, longer implementation, and the value depends on integrating its recommendations into your existing pipelines.
Where it wins: mixed estates. If Kubernetes is a large part of your infrastructure but far from all of it, a tool reasoning across containers and VMs together avoids the gap where two tools each optimize their half and nobody optimizes the boundary.
Where it stops: it's an analytics and recommendation layer rather than an execution engine, and it's priced and sold for large organizations. For a Kubernetes-only shop it's heavier than the problem requires.
Pick it if: you're an enterprise with significant VM estate alongside Kubernetes and want one model across both.
Category 3: Node and Capacity Optimization
Layers 2 and 3 — the hardware your right-sized pods land on, and what you pay per hour for it. This category typically moves the bill fastest, because it changes what you're billed for rather than what you request.
8. CAST AI
CAST AI is the most aggressive automation platform in this list. It replaces the Cluster Autoscaler, manages spot instances including interruption handling and automatic fallback, optimizes bin-packing, selects instance types, and rightsizes workloads — across AWS, GCP and Azure.
How it works. After connecting, it runs in a read-only analysis mode that produces a savings estimate. Enabling automation hands it control of node provisioning, at which point it continuously replaces your node mix with cheaper equivalents and consolidates workloads.
Adoption friction: low to connect and analyse, significant to fully enable. Handing over the compute layer is a real decision that deserves a non-production cluster first.
Where it wins: when your dominant waste is at the node layer. If you're on-demand with poor packing, this is the category that moves your bill fastest and CAST AI is the most complete option in it. Spot automation done properly — with interruption handling and fallback — is genuinely hard to build yourself.
Where it stops: it takes real control of your compute layer, which is the point and also the risk. Pricing is typically tied to managed spend, so model it at your actual scale. Worth noting too: the utilization benchmarks everyone cites in this space, including in this article, are CAST AI's own research. It's good data with a real methodology, and it's also marketing from a vendor who sells the fix. Read it with both facts in mind.
Pick it if: node-layer waste dominates and you want it handled automatically across clouds.
9. Karpenter
Karpenter is the open-source, CNCF-hosted node provisioner that has largely displaced the Cluster Autoscaler on AWS. Instead of scaling predefined node groups, it looks at pending pods and provisions the instance that actually fits them.
The cost-relevant behaviour is consolidation: Karpenter actively repacks workloads onto fewer nodes and terminates the empties, rather than waiting for a node to become completely idle.
apiVersion: karpenter.sh/v1
kind: NodePool
metadata:
  name: default
spec:
  template:
    spec:
      requirements:
        - key: karpenter.sh/capacity-type
          operator: In
          values: ["spot", "on-demand"]
        - key: kubernetes.io/arch
          operator: In
          values: ["amd64", "arm64"]
        - key: karpenter.k8s.aws/instance-category
          operator: In
          values: ["c", "m", "r"]
      nodeClassRef:
        group: karpenter.k8s.aws
        kind: EC2NodeClass
        name: default
  disruption:
    consolidationPolicy: WhenEmptyOrUnderutilized
    consolidateAfter: 30s
    budgets:
      - nodes: "10%"
  limits:
    cpu: 1000
Three settings above do most of the work. Allowing spot alongside on-demand opens Layer 3. Including arm64 lets Karpenter choose Graviton instances where your images support them. And consolidationPolicy: WhenEmptyOrUnderutilized is what actually shrinks the node count — the budgets block limits how much churn happens at once.
Adoption friction: moderate. Migrating from Cluster Autoscaler means new IAM roles, NodePool definitions and a careful cutover. Workloads need correct PodDisruptionBudgets before you enable aggressive consolidation, or you'll cause avoidable disruption.
Where it wins: free, CNCF-governed, and excellent at Layers 2 and 3. Enabling spot and consolidation in a Karpenter NodePool is one of the highest-leverage changes available to most AWS clusters, at zero licence cost.
Where it stops: it knows nothing about cost attribution and won't touch your pod requests. Karpenter will happily provision beautifully efficient nodes for workloads requesting four times what they use — it optimizes the container, not the contents.
Pick it if: you're on AWS and haven't migrated off Cluster Autoscaler yet. This is the highest ROI item on most teams' list.
10. Zesty
Zesty automates the commitment layer — dynamically adjusting reserved instance coverage as demand changes — alongside disk and capacity optimization.
How it works. Rather than requiring you to forecast baseline usage a year ahead and commit, it manages commitment coverage dynamically, buying and selling to track actual consumption.
Adoption friction: low technically, but it involves the tool transacting on your commitments, which is a finance and procurement conversation.
Where it wins: organizations with large, steady baseline spend where commitment coverage is a meaningful lever and managing it manually has become a job nobody wants. The disk-level automation is a genuinely overlooked waste category.
Where it stops: it's adjacent to Kubernetes rather than native to it. It won't help with pod requests, namespace attribution, or bin-packing.
Pick it if: your spend is large and predictable and commitment management is the unowned gap.
11. AWS Compute Optimizer
AWS Compute Optimizer is free, already enabled in your account, and analyses EC2 instances, Auto Scaling groups, EBS volumes and Lambda functions using machine learning over CloudWatch metrics.
Adoption friction: effectively zero. Turn it on and read the recommendations.
Where it wins: free and instant. There is no good reason to buy anything before looking at what AWS already tells you. Its EBS recommendations in particular surface waste that Kubernetes-native tools often miss entirely, since persistent volumes are frequently orphaned when workloads move.
Where it stops: it reasons about instances, not pods. It cannot see that a namespace requests 8 cores and uses one, because from EC2's perspective the node is legitimately busy running a scheduler that believes those requests. It's also AWS-only.
Pick it if: you're on AWS and haven't checked it. Do this before your first vendor call.
GPU Cost: The Fastest-Growing Waste Category
GPU utilization averages 5% — the worst number in the entire benchmark, on the most expensive hardware in the cluster. As Kubernetes becomes the default platform for AI and ML workloads, this is becoming the largest line item on many bills, and most cost tooling still treats it as an afterthought.
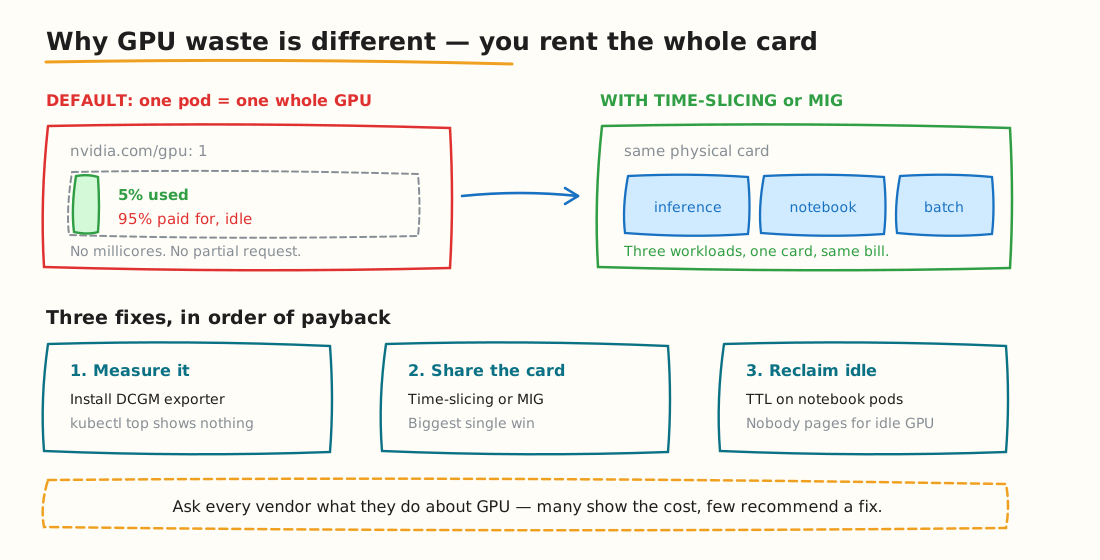
A pod requesting one GPU takes the whole card whether it uses 5% or 95% of it. Time-slicing and MIG are what turn that into shared capacity.
Why GPUs waste differently
- They are allocated whole. A pod requesting
nvidia.com/gpu: 1takes an entire GPU whether it uses 5% or 95% of it. There is no equivalent of CPU millicores unless you enable time-slicing or MIG. - Notebooks never stop. A data scientist's Jupyter pod holds a GPU overnight, over weekends and through holidays. Nobody gets paged for an idle GPU.
- Training is bursty, inference is steady. Sizing one node pool for both wastes capacity in both directions.
- Standard metrics miss it entirely.
kubectl topreports CPU and memory. GPU utilization needs DCGM exporter or equivalent, which many clusters simply do not run.
Where to start
# Which workloads hold GPUs?
kubectl get pods -A -o json \
  | jq -r '.items[] | select(.spec.containers[].resources.requests["nvidia.com/gpu"]) | "\(.metadata.namespace)/\(.metadata.name)"'

# GPU nodes and what is scheduled on them
kubectl get nodes -l nvidia.com/gpu.present=true -o wide- Install DCGM exporter first. You cannot optimize what you cannot measure, and GPU utilization is not in the default metrics pipeline.
- Enable time-slicing or MIG for inference and development workloads. Multiple pods sharing one accelerator is usually the single biggest win available.
- Set idle TTLs on notebook pods. An idle-timeout on development GPU workloads often recovers more spend than an entire CPU rightsizing exercise.
- Separate training from inference node pools so bursty jobs stop holding steady-state capacity hostage.
Tool coverage here is uneven. Ask any vendor specifically what they do about GPU — several will happily show you GPU cost but have no recommendation engine behind it, which is visibility without action all over again.
Which Tool for Which Cluster Profile
Map your situation to a starting point rather than evaluating all twelve.
| Your situation | Dominant layer | Start with |
|---|---|---|
| Can't answer "what does this team cost?" | Layer 4 | OpenCost, then Kubecost if you need support |
| CPU utilization under 15%, node count sane | Layer 1 | Goldilocks to measure, then StormForge / ScaleOps / Atmosly |
| Utilization fine, nodes half-empty | Layer 2 | Karpenter with consolidation enabled |
| 100% on-demand instances | Layer 3 | Karpenter with spot, or CAST AI for full automation |
| Running ArgoCD/Flux, past changes reverted | Layer 1 + durability | A tool that writes to Git, not the live cluster |
| Large VM estate alongside Kubernetes | Mixed | Densify |
| CFO asking cost per customer | Layer 4 (business) | CloudZero |
| Large steady baseline, no commitments | Layer 3 | Zesty, or native Savings Plans |
| On AWS, haven't looked at anything yet | Unknown | AWS Compute Optimizer — free, today |
How to Actually Evaluate These
Vendor claims in this category are unusually loud, and savings estimates are generated by the party selling the fix. A structured two-week trial beats any comparison table, including this one.
- Days 1–2: baseline. Install something free and read-only — OpenCost or Goldilocks — and record current CPU/memory utilization, node count, and cost per namespace. Write the numbers down before any vendor sees them.
- Days 3–5: identify your dominant layer. Use the scoring commands above. This determines your shortlist and it's the step most teams skip, which is why they end up with a tool that optimizes the layer they didn't have a problem with.
- Days 6–8: observe without applying. Run candidates in recommendation mode. Check output against three workload types: a stateless service, a batch job, and a StatefulSet. A tool recommending aggressive cuts on a bursty workload is telling you something important about its model.
- Days 9–12: enforce on one namespace. Pick something non-critical. Apply changes. Measure provisioned-CPU reduction, node count, and reliability — OOM kills, throttling events, p99 latency. A cost cut that degrades SLOs is not a saving, it's a deferred incident.
- Days 13–14: test durability. If you run GitOps, force a sync and confirm the change is still there. This is where directly-applied changes quietly revert, and it is the single most under-tested step in most evaluations.
Questions worth asking every vendor
- Does it act, or only recommend? The difference between a dashboard and a smaller bill.
- How does it handle GitOps? If the answer is vague, assume your changes become drift.
- What happens when a recommendation is wrong? Look for revert windows, automatic rollback, OOM and throttle guards.
- Is idle cost separated from allocated cost? Smearing idle across teams makes chargeback meaningless and destroys trust in the numbers.
- Does it need complete tagging to work? If yes, budget for the tagging project as part of the cost.
- How is it priced at our scale? Percentage-of-managed-spend and per-vCPU models diverge sharply as you grow. Model both at your real node count.
- What does it do about GPU? At 5% average utilization this is the fastest-growing waste category and many tools still ignore it.
Three mistakes that waste the evaluation
- Buying before baselining. If you don't know your starting utilization, you cannot verify any vendor's savings claim — including after you've paid for it.
- Optimizing Layer 1 alone. Right-sized pods on unchanged nodes produce headroom, not savings. You need the node layer to consolidate afterwards.
- Measuring cost without reliability. Every tool can cut spend if allowed to cut deep enough. Track OOM kills and latency percentiles alongside the savings number, or you'll find out the hard way.
What Happens After You Pick a Tool
Buying the tool is the easy part. Teams that actually reduce spend treat this as an operating practice rather than a project; the ones that don't end up with an expensive dashboard nobody opens.
Someone has to own the recommendations
Rightsizing recommendations accumulate. If nobody is accountable for reviewing them, they pile up until the backlog is intimidating enough to ignore entirely. The pattern that works is a named owner — usually on the platform team — a fixed weekly cadence, and a rule that any recommendation above a savings threshold is either actioned or explicitly declined with a reason.
Route them where engineers already work
A recommendation in a dashboard is a task someone has to remember. A recommendation arriving as a pull request in a repo the team already reviews is just another PR. That is the practical argument for GitOps-delivered changes beyond the drift question — it puts the work inside an existing workflow instead of creating a new one.
Track realized savings, not potential
Every tool will show you potential savings. That number is marketing until something merges. What matters is the ledger: how much was identified, how much was applied, and how much actually showed up on the bill. Teams that track only potential savings routinely believe they have saved money they have not.
Re-baseline quarterly
Workloads change, traffic grows, and new services ship with conservative defaults. Overprovisioning climbing from 40% to 69% year over year is exactly what happens when optimization is treated as a one-time exercise. Rightsizing that runs once at deployment is not rightsizing.
Key Takeaways
- The waste is structural, not carelessness. 8% CPU and 20% memory across tens of thousands of clusters is a pattern produced by rational individual decisions, not a set of mistakes.
- Visibility and optimization are different products. OpenCost, Kubecost and CloudZero report. CAST AI, StormForge, ScaleOps, Karpenter and Atmosly change something.
- Identify your dominant layer before shortlisting. A node provisioner won't fix over-provisioned pods, and a rightsizer won't fix on-demand pricing.
- Most clusters need two or three tools. Typically one for attribution, one for rightsizing, one for the node layer. Anyone selling a single tool for all four layers is overselling, which is why any list of the best Kubernetes cost optimization tools for 2026 should be read as a menu, not a ranking.
- Start free. OpenCost, Goldilocks, Karpenter and AWS Compute Optimizer cost nothing and will tell you whether you need to buy anything at all.
- Test durability, not just savings. In a GitOps cluster, a change that doesn't survive the next sync was never a saving.
- Treat vendor benchmarks as directional. The best data in this space comes from companies selling the remedy. Useful, and worth reading with that in mind.
See Where Your Own Cluster Sits
Benchmarks are useful for sizing the problem, but the only numbers that matter are yours.
- Connect a cluster read-only for a free audit — see your actual utilization, idle capacity and per-namespace attribution. Nothing changes in your cluster, no sales call.
- Or start on the free tier — one cluster, one environment, no credit card.
- Want the deeper picture first? Read how Atmosly approaches Kubernetes cost optimization, or the guide to cost allocation by namespace and team.