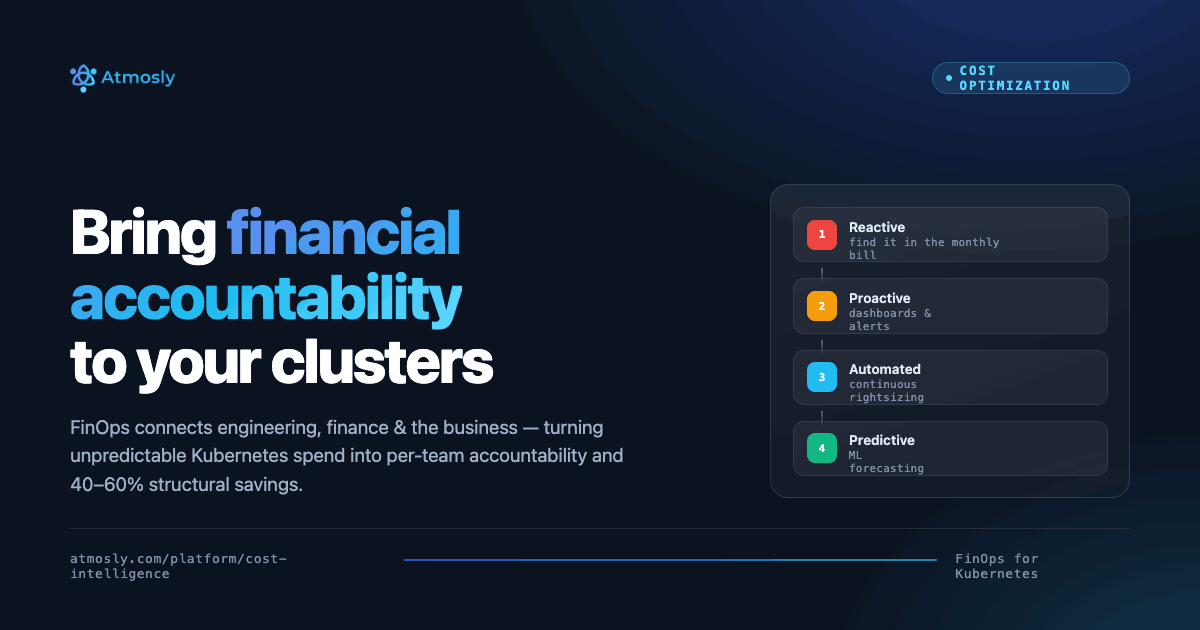
Introduction: The Right-Sizing Challenge
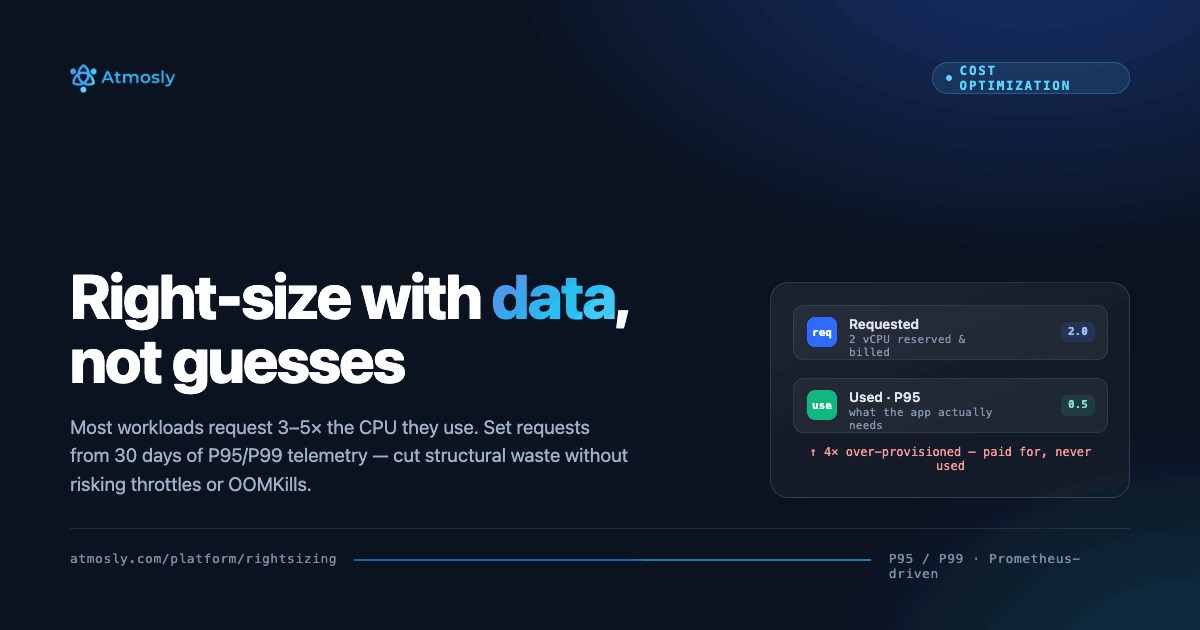
Right-sizing Kubernetes workloads—configuring CPU and memory resource requests and limits that align with actual application consumption—represents the fastest path to structural cost savings in container environments. Yet most organizations operate with massive over-provisioning: average request-to-usage ratios of 3-5x for CPU and 2-4x for memory. This means for every CPU core or gigabyte of memory actually consumed by applications, teams have requested and pay for three to five times that amount, resulting in billions of wasted CPU milliseconds and terabytes of unused memory capacity.
The over-provisioning epidemic stems from multiple causes: developers request resources conservatively "to be safe" without measuring actual needs, copy-paste inheritance from example manifests designed for different workload profiles, lack of production telemetry during initial deployment forcing engineers to guess, organizational risk aversion preferring waste over potential performance issues, and absence of feedback loops showing teams the financial impact of their resource requests. When compounded across hundreds of microservices and thousands of pods, cumulative waste reaches staggering proportions.
However, aggressive under-sizing poses equally serious risks: insufficient CPU causes throttling degrading latency and throughput, inadequate memory triggers OOMKilled terminations interrupting service, under-provisioned requests lead to poor scheduler decisions placing pods on nodes lacking actual capacity, and overly tight limits prevent handling legitimate traffic spikes. The key challenge is finding balance: resource configurations providing necessary safety buffers while eliminating structural waste.
This comprehensive guide provides a systematic, data-driven methodology for safely rightsizing Kubernetes workloads at scale using Prometheus for telemetry collection and platforms like Atmosly that automate the analysis. You'll learn how to collect 30 days of accurate utilization data, analyze usage at appropriate percentiles (P95/P99) rather than misleading averages, calculate recommended requests and limits with workload-specific safety buffers, validate changes through testing before production rollout, implement gradually while monitoring impact, and establish continuous re-analysis as applications evolve.
Understanding Kubernetes Resource Management
Requests vs Limits: The Two-Tier Model
Kubernetes uses a dual-tier resource management system that many engineers misunderstand:
Resource Requests (Scheduling Guarantee):
- Define the minimum resources that Kubernetes guarantees the container
- Scheduler uses requests for pod placement decisions—only schedules pods on nodes with sufficient unreserved capacity
- Requests do NOT limit consumption—containers can use more if node capacity available
- Determine pod Quality of Service (QoS) class affecting eviction priority during resource pressure
- Cloud billing based on node capacity, but over-requesting drives unnecessary node scale-out increasing infrastructure spend
Resource Limits (Hard Ceiling):
- Define the maximum resources a container may consume
- CPU limits enforced through throttling—kernel pauses execution if container exceeds limit
- Memory limits enforced through OOMKill—kubelet terminates container immediately if it exceeds memory limit
- Limits do NOT affect scheduling—scheduler ignores limits when placing pods
- Setting limits too low causes artificial performance degradation even when node has spare capacity
Example Configuration:
apiVersion: apps/v1
kind: Deployment
metadata:
  name: payment-api
spec:
  replicas: 10
  template:
    spec:
      containers:
      - name: api
        image: payment-api:v2.4
        resources:
          requests:
            cpu: 500m        # Scheduler guarantees 0.5 CPU cores
            memory: 1Gi      # Scheduler guarantees 1 GB RAM
          limits:
            cpu: 1000m       # Maximum 1 CPU core (throttled if exceeded)
            memory: 2Gi      # Maximum 2 GB RAM (OOMKilled if exceeded)
Quality of Service (QoS) Classes
Resource configuration determines pod QoS class affecting eviction priority during node pressure:
| QoS Class | Configuration | Eviction Priority | Use Case |
|---|---|---|---|
| Guaranteed | Requests = Limits for all resources | Lowest (last to evict) | Critical production services requiring predictable performance |
| Burstable | Requests < Limits (or only requests set) | Medium | Most production workloads—can burst during peaks but don't need guarantees |
| BestEffort | No requests or limits defined | Highest (first to evict) | Non-critical batch jobs tolerating interruption |
Common Misconfiguration Patterns
Anti-Pattern 1: Massive Over-Requesting
# BAD: Developer "playing it safe" without data
resources:
  requests:
    cpu: 4000m      # 4 full CPU cores requested
    memory: 8Gi     # 8 GB RAM requested
  limits:
    cpu: 8000m
    memory: 16Gi

# Reality: Actual P99 usage is 450m CPU, 950Mi memory
# Result: 8.9x CPU over-provisioned, 8.6x memory over-provisioned
# Cost: $890/month per pod vs $98/month if properly sized
# Waste: $792/month per pod × 10 replicas = $7,920/month wasted
Anti-Pattern 2: No Resource Requests (BestEffort)
# BAD: No resource management
resources: {}  # No requests or limits

# Impact: Pod gets BestEffort QoS (evicted first during pressure)
# Risk: Unpredictable performance, scheduler places on any node regardless of capacity
# Problem: No cost attribution (can't track which team consumed resources)
Anti-Pattern 3: Limits Without Requests
# SUBOPTIMAL: Only limits defined
resources:
  limits:
    cpu: 2000m
    memory: 4Gi
  # No requests specified

# Behavior: Kubernetes automatically sets requests = limits
# Result: Forces Guaranteed QoS when Burstable would be more appropriate
# Impact: Wastes resources that could be shared across workloads
Phase 1: Collect 30 Days of Prometheus Telemetry
Prerequisites: Prometheus and Metrics Exporters
Right-sizing requires historical utilization data from Prometheus with these components:
- kube-state-metrics: Exposes resource requests, limits, and pod metadata
- node-exporter: Provides node-level CPU, memory, disk metrics
- cAdvisor: Embedded in kubelet, exposes container-level usage metrics
If Prometheus not deployed, install with 30-day retention minimum:
helm repo add prometheus-community https://prometheus-community.github.io/helm-charts
helm install prometheus prometheus-community/prometheus \
  --namespace monitoring \
  --create-namespace \
  --set server.retention=30d \
  --set server.persistentVolume.size=100Gi
Essential Metrics for Rightsizing
CPU Metrics (per container):
# Actual CPU usage (cores per second)
container_cpu_usage_seconds_total

# CPU requests (what was requested)
kube_pod_container_resource_requests{resource="cpu"}

# CPU limits
kube_pod_container_resource_limits{resource="cpu"}

# CPU throttling (indicates limits too low)
container_cpu_cfs_throttled_seconds_total
container_cpu_cfs_periods_total
Memory Metrics (per container):
# Actual memory usage (working set, excludes cache)
container_memory_working_set_bytes

# Memory requests
kube_pod_container_resource_requests{resource="memory"}

# Memory limits
kube_pod_container_resource_limits{resource="memory"}

# OOMKill events (indicates limits too low)
kube_pod_container_status_terminated_reason{reason="OOMKilled"}
Data Collection Best Practices
1. Minimum 14-Day Lookback (30 Days Recommended)
Collect at least two full business weeks to capture:
- Weekday vs weekend traffic patterns
- Peak load periods (morning login rush, nightly batch processing)
- Weekly cycles (Monday traffic spikes, Friday drop-offs)
- Monthly patterns (end-of-month reporting, payroll processing)
2. Scrape Interval: 15-60 Seconds
# Prometheus scrape configuration
scrape_configs:
  - job_name: 'kubernetes-pods'
    scrape_interval: 30s      # Balance granularity vs storage
    scrape_timeout: 10s
    kubernetes_sd_configs:
      - role: pod
3. Segment by Workload Criticality
# Label pods by criticality tier for differentiated safety buffers
kubectl label deployment payment-api tier=tier1-critical
kubectl label deployment analytics-batch tier=tier3-batch
kubectl label deployment internal-dashboard tier=tier2-standard
Phase 2: Analyze at Appropriate Percentiles
Why Percentiles Matter More Than Averages
Using average utilization for rightsizing is a critical mistake causing under-provisioning and performance degradation:
| Metric | Value | If Used for Sizing |
|---|---|---|
| Average CPU | 320m | Under-provisioned 50% of time (throttling) |
| P50 (median) | 380m | Under-provisioned 50% of time |
| P95 | 680m | Under-provisioned 5% of time (acceptable) |
| P99 | 1150m | Under-provisioned 1% of time (conservative) |
| Max | 2400m | Over-provisioned (may be anomaly/restart spike) |
If you set CPU requests to 320m (average), application will be under-provisioned during 50% of operating time causing throttling and latency degradation. If you set to 2400m (max), you're over-provisioning for potentially anomalous spikes.
Recommended Percentile Targets by Workload Type
| Workload Type | Target Percentile | Safety Buffer | Rationale |
|---|---|---|---|
| Tier-1 Critical (payments, auth) | P99 | 25-30% | Minimize any performance risk |
| User-Facing Services (APIs, web) | P95 | 20-25% | Balance cost and acceptable occasional throttling |
| Internal Services (dashboards) | P90 | 15-20% | Cost-optimized, tolerate occasional degradation |
| Batch/Background Jobs | P85 | 10-15% | Aggressive optimization, throughput over latency |
Prometheus Queries for Percentile Analysis
# Calculate P95 CPU usage over 30 days for payment-api
quantile_over_time(0.95,
  rate(container_cpu_usage_seconds_total{
    pod=~"payment-api-.*",
    container="api"
  }[5m])[30d:5m]
)

# Calculate P99 memory usage over 30 days
quantile_over_time(0.99,
  container_memory_working_set_bytes{
    pod=~"payment-api-.*",
    container="api"
  }[30d:1m]
)

# Identify top 20 over-provisioned workloads (request/usage ratio)
topk(20,
  kube_pod_container_resource_requests{resource="cpu"} /
  on(pod,container) rate(container_cpu_usage_seconds_total[7d])
)
Phase 3: Automated Analysis with Atmosly
Manual Analysis Pain Points
Rightsizing 100+ workloads manually requires:
- 4-8 hours writing PromQL queries per workload
- Exporting data to spreadsheets for percentile calculations
- Manually determining appropriate safety buffers per workload type
- Calculating cost impact using AWS/GCP pricing data
- Generating Kubernetes YAML patches for each service
- Total effort: 40-60 hours for 100 workloads (monthly re-analysis needed)
How Atmosly Automates Rightsizing
Instead of manual Prometheus analysis, Atmosly connects to existing Prometheus and automates the entire workflow:
Step 1: Cluster Import (15 minutes)
# Import cluster via Atmosly UI
1. Navigate to: Clusters → Import Cluster
2. Select: AWS EKS / GCP GKE / Azure AKS / Other Kubernetes
3. Provide: Cluster name, region, credentials
4. Atmosly validates: Kubernetes API access, Prometheus connectivity
5. Auto-discovery: Finds Prometheus service endpoint automatically
Step 2: Automatic 30-Day Data Ingestion (2 hours)
- Atmosly connects to Prometheus service (prometheus-server.monitoring)
- Pulls 30 days of container CPU and memory metrics
- Collects resource requests, limits, and pod metadata from kube-state-metrics
- Identifies workload types (Deployment, StatefulSet, Job, CronJob, DaemonSet)
- Classifies by criticality based on namespace labels and naming patterns
Step 3: ML-Powered Recommendation Generation
Atmosly's algorithm automatically:
- Calculates P50, P90, P95, P99, and max usage for each container
- Applies workload-specific percentile targets (P95 for standard, P99 for critical)
- Adds appropriate safety buffers (20-30% headroom above target percentile)
- Enforces minimum thresholds (100m CPU, 128Mi memory) preventing under-provisioning
- Calculates burst capacity limits (typically 2x requests)
- Computes current monthly cost vs recommended monthly cost
- Ranks recommendations by dollar savings potential
Step 4: Dashboard with Actionable Recommendations
| Workload | Container | Current Cost | Optimized Cost | Savings | Over-Prov % |
|---|---|---|---|---|---|
| payment-api | api | $24.50/mo | $6.85/mo | $17.65 | 72% |
| analytics-job | processor | $18.20/mo | $4.20/mo | $14.00 | 77% |
| prometheus-grafana | grafana | $10.96/mo | $0.66/mo | $10.30 | 94% |
Total Time: 2 hours (vs 40-60 hours manual)
Phase 4: Calculate Recommendations with Safety Buffers
Recommendation Formula
For CPU Requests:
Recommended_CPU_Request = P95_CPU_Usage × (1 + Safety_Buffer)

Example (standard tier-2 service):
  P95 CPU usage over 30 days: 680m
  Safety buffer: 20%
  Recommended CPU request: 680m × 1.20 = 816m (round to 850m)
For Memory Requests:
Recommended_Memory_Request = P95_Memory_Usage × (1 + Safety_Buffer)

Example:
  P95 Memory usage: 950Mi
  Safety buffer: 20%
  Recommended memory request: 950Mi × 1.20 = 1140Mi (round to 1200Mi)
For Limits (Burst Capacity):
Recommended_CPU_Limit = Recommended_CPU_Request × Burst_Multiplier

Typical burst multipliers:
  - Stateless APIs: 2.0x (allow 2x burst)
  - Databases: 1.5x (less burstable, consistent usage)
  - Batch jobs: 3.0x (highly variable, benefit from burst)

Example:
  Recommended request: 850m
  Burst multiplier: 2.0x
  Recommended limit: 1700m
Guardrails Preventing Under-Provisioning
# Minimum thresholds (prevent aggressive under-sizing)
MINIMUM_CPU_REQUEST = 100m      # Prevent excessive throttling
MINIMUM_MEMORY_REQUEST = 128Mi  # Prevent OOMKills

# Maximum single reduction (staged rollout)
MAX_REDUCTION_PERCENTAGE = 50%  # Don't cut more than 50% at once

# Exclusion criteria
EXCLUDE_IF:
  - Label: cost-optimization=disabled
  - Label: rightsizing=manual
  - Insufficient data: < 7 days metrics
  - High variance: stddev > 2x mean
Real Example: payment-api Container
# BEFORE (Over-Provisioned)
resources:
  requests:
    cpu: 2000m        # 2 full CPU cores
    memory: 4Gi       # 4 GB RAM
  limits:
    cpu: 4000m
    memory: 8Gi

# ATMOSLY 30-DAY ANALYSIS
P50 CPU: 320m | P95 CPU: 680m | P99 CPU: 1150m | Max: 1680m
P50 Mem: 720Mi | P95 Mem: 950Mi | P99 Mem: 1280Mi | Max: 1520Mi

Workload tier: tier-2 (standard)
Target percentile: P95
Safety buffer: 20%

# RECOMMENDED (Data-Driven)
resources:
  requests:
    cpu: 850m         # 680m P95 + 25% = 850m (58% reduction)
    memory: 1200Mi    # 950Mi P95 + 26% = 1200Mi (71% reduction)
  limits:
    cpu: 1700m        # 2x requests for burst
    memory: 2400Mi    # 2x requests for burst

# COST IMPACT
Current cost: $24.50/month per pod
Recommended cost: $6.85/month per pod
Monthly savings: $17.65 per pod
Cluster savings (10 replicas): $176.50/month
Annual savings: $2,118/year for this one service
Phase 5: Validate Before Production
Staging Environment Testing
- Apply recommendations to staging first
- Run load tests mimicking production traffic
- Monitor SLIs closely: P95/P99 latency, error rate, CPU throttling, OOMKills
- Validate for 48-72 hours before production
# Load test with k6
k6 run --vus 500 --duration 30m load-test.js

# Monitor during load test
kubectl top pods -n staging | grep payment-api

# Check for throttling (should be < 5%)
kubectl exec -n staging prometheus-0 -- promtool query instant \
  'sum(rate(container_cpu_cfs_throttled_seconds_total{pod=~"payment-api-.*"}[5m])) /
   sum(rate(container_cpu_cfs_periods_total{pod=~"payment-api-.*"}[5m]))'
Progressive Production Rollout
Wave 1: 10% of Replicas (Week 1)
# Update 1 of 10 pods
kubectl patch deployment payment-api --type=json -p='[
  {"op": "replace", "path": "/spec/template/spec/containers/0/resources/requests/cpu", "value": "850m"},
  {"op": "replace", "path": "/spec/template/spec/containers/0/resources/requests/memory", "value": "1200Mi"}
]'

# Monitor for 48 hours
# Compare metrics between old (2000m/4Gi) and new (850m/1200Mi) pods
Wave 2: 50% of Replicas (Week 2, if Wave 1 successful)
Wave 3: 100% Rollout (Week 3, if Wave 2 successful)
Phase 6: Monitor and Iterate
Post-Deployment Monitoring
Critical SLIs to Track:
| Metric | Target | Alert Threshold | Action if Exceeded |
|---|---|---|---|
| P95 Latency | No increase | >10% increase | Rollback immediately |
| Error Rate | < 0.1% | >0.15% | Investigate, consider rollback |
| CPU Throttling | < 5% | >10% | Increase CPU request 20% |
| OOMKill Events | Zero | Any OOMKill | Increase memory request 30% |
| Pod Restart Rate | < 1/day | >3/day | Rollback and investigate |
Continuous Re-Analysis Cadence
- Weekly: Review top 20 workloads for new optimization opportunities
- Monthly: Full cluster re-analysis with updated 30-day utilization (Atmosly automates)
- After Major Releases: Re-baseline if application behavior changes significantly
- Seasonal Adjustments: Update safety buffers before known traffic spikes (Black Friday, tax season)
Expected Results and ROI
Typical Savings by Resource Type
| Resource | Typical Over-Prov | Achievable Reduction | Example Savings (100 pods) |
|---|---|---|---|
| CPU | 3-5x | 40-60% | $12,000-$18,000/month |
| Memory | 2-4x | 30-50% | $6,000-$12,000/month |
| Total | — | 35-55% | $18K-$30K/month |
Time Investment vs Savings
Manual Approach (Open Source Tools):
- Initial setup: 40-60 hours (Prometheus, VPA, custom dashboards)
- Monthly analysis: 20-30 hours (PromQL queries, spreadsheet analysis, YAML generation)
- Timeline to savings: 6-8 weeks
- Total: 100+ hours for first month
Atmosly Approach:
- Initial setup: 15 minutes (cluster import)
- Monthly analysis: 2 hours (review recommendations, approve changes)
- Timeline to savings: 1 week
- Total: 2 hours for first month (98% less effort)
Common Pitfalls and Solutions
Pitfall 1: Using Average Instead of Percentiles
Problem: Setting requests based on average under-provisions during 50% of operating time.
Solution: Always use P95 (standard services) or P99 (critical services) plus 20-30% safety buffer.
Pitfall 2: Ignoring Seasonal Patterns
Problem: Rightsizing based on current 30 days fails when Black Friday or tax season hits.
Solution: Include peak periods in analysis window, or add growth buffers for rapidly scaling services, re-baseline after major launches.
Pitfall 3: Optimizing Everything Simultaneously
Problem: Applying changes to 100+ services at once makes root cause impossible if issues occur.
Solution: Phased rollout—staging first (week 1), non-critical prod (week 2-3), critical services conservatively (week 4-5).
Pitfall 4: Setting CPU Limits Too Low
Problem: Aggressive CPU limits cause throttling even when node has spare capacity.
Solution: Set CPU limits 2-3x requests allowing burst. Consider removing CPU limits entirely for non-critical workloads (limits don't affect scheduling).
Conclusion: Rightsizing as Continuous Discipline
Right-sizing Kubernetes workloads delivers 35-55% cost reduction when done systematically with data-driven analysis rather than guesswork. The key success factors: collecting 30+ days of Prometheus metrics capturing weekly and monthly patterns, analyzing at appropriate percentiles (P95/P99) with workload-specific safety buffers, validating thoroughly in staging before production, rolling out progressively monitoring SLIs closely, and re-analyzing continuously as applications evolve.
Organizations leveraging Atmosly to automate Prometheus analysis achieve these results in 1-2 weeks with 98% less engineering effort compared to 6-8 weeks manual approach. Atmosly connects to existing monitoring infrastructure, requires no new agents or sidecars, and delivers recommendations within 2 hours of cluster import.
Related Guides
- Kubernetes FinOps: Complete Guide for Engineering Teams — the FinOps framework rightsizing fits into.
- How to Fix Kubernetes OOMKilled Errors — avoid the failure mode of cutting memory too aggressively.
- Atmosly Cost Intelligence — automated P95-based rightsizing recommendations with safety buffers.
Ready to rightsize your Kubernetes workloads? Import your cluster into Atmosly and get rightsizing recommendations based on your actual Prometheus data in 2 hours. Free trial, no credit card required.
Questions about rightsizing methodology? Schedule a consultation with our solutions team to review your specific workload patterns and optimization potential.