Introduction: What is Kubernetes FinOps
Kubernetes FinOps—the practice of bringing financial accountability to cloud-native infrastructure—has emerged as a critical discipline for engineering teams. As organizations migrate to microservices running on Kubernetes, cloud costs become variable, unpredictable, and often spiraling out of control. Traditional budgeting (static annual forecasts) fails catastrophically in dynamic container environments where resources scale elastically based on demand.
FinOps bridges the gap between engineering teams who deploy infrastructure, finance teams who manage budgets, and business leaders who need to understand ROI. It's not about cutting costs at any expense—it's about making informed trade-offs between speed, reliability, and cost efficiency. Organizations with mature FinOps practices achieve 40-60% cost reduction while maintaining or improving service reliability through better resource utilization and data-driven decision making.
This comprehensive guide covers everything engineering teams need to build a Kubernetes FinOps practice: core principles, establishing cost visibility, implementing allocation strategies, forecasting methodologies, automation opportunities, organizational maturity progression, and how platforms like Atmosly accelerate FinOps by connecting to existing Prometheus infrastructure to provide instant cost intelligence and rightsizing recommendations.
Core Principles of Kubernetes FinOps
Principle 1: Visibility Enables Accountability
You cannot manage what you cannot measure. The foundational FinOps principle is comprehensive cost visibility at multiple granularity levels—cluster, namespace, workload, pod, and container. Traditional cloud billing (AWS Cost Explorer, GCP Cloud Billing) provides EC2 or GKE instance costs but lacks Kubernetes context. A $50,000 monthly compute line item tells you nothing about which teams, applications, or environments consumed those resources.
Kubernetes-Native Cost Allocation Requirements:
- Map cloud infrastructure spend to Kubernetes namespaces and pods
- Attribute shared costs (control plane, load balancers, storage) proportionally
- Track cost per team, per environment, per application
- Calculate efficiency metrics (request-to-usage ratios exposing waste)
- Provide real-time dashboards accessible to all engineers, not just finance
Example Cost Visibility Dashboard:
| Namespace | Team | Monthly Cost | % of Total | Efficiency |
|---|---|---|---|---|
| production-payments | Payments Squad | $12,400 | 28% | 62% |
| production-fraud | Risk Squad | $8,200 | 18% | 71% |
| staging-all | Platform Team | $6,800 | 15% | 38% |
| preview-envs | All Teams | $5,400 | 12% | 18% |
When engineers see costs attributed to their deployments, behavior changes organically—teams voluntarily clean up unused resources, rightsize over-provisioned workloads, and consider financial impact before requesting 8 CPU cores when 500 millicores would suffice.
Principle 2: Decentralized Ownership with Centralized Governance
Effective FinOps empowers engineering teams to make cost decisions (decentralized ownership) within guardrails established by platform and finance teams (centralized governance). This balance prevents two failure modes:
Failure Mode 1: Pure Centralization
- Central FinOps team tries to optimize every service across the organization
- Becomes a bottleneck—engineers wait weeks for resource approval
- Decisions made without application context cause performance issues
- Innovation velocity slows as teams navigate bureaucracy
Failure Mode 2: Pure Decentralization
- Every team operates independently without shared standards
- No coherent cost strategy, duplicated optimization efforts
- Budget overruns with no clear accountability
- Inconsistent practices make cross-team coordination impossible
The FinOps Balance:
- Platform Teams: Define organizational policies (max resource requests, required labels, cleanup TTLs)
- Automation: Encode policies as code preventing waste at deployment time
- Product Teams: Full autonomy to provision resources within policy guardrails
- Visibility: Real-time cost feedback through dashboards and Slack notifications
- Accountability: Team-level cost metrics in sprint reviews and OKRs
Principle 3: Optimization Is Continuous, Not One-Time
Many organizations treat cost optimization as a quarterly fire drill: finance alerts that Kubernetes spend is over budget, engineers scramble to identify waste through manual spreadsheet analysis, costs temporarily drop, then within 4-8 weeks costs creep back to previous levels as new services deploy without cost consideration. This reactive cycle is unsustainable.
Continuous FinOps Practices:
- Automated Analysis: Weekly re-evaluation of workload utilization generating new rightsizing recommendations
- CI/CD Integration: Cost impact analysis on every pull request before merge
- Scheduled Cleanup: Preview environments auto-deleted after idle periods, orphaned volumes removed
- Anomaly Detection: Real-time alerts when namespace costs spike unexpectedly
- Policy Enforcement: Admission controllers blocking wasteful configurations before reaching production
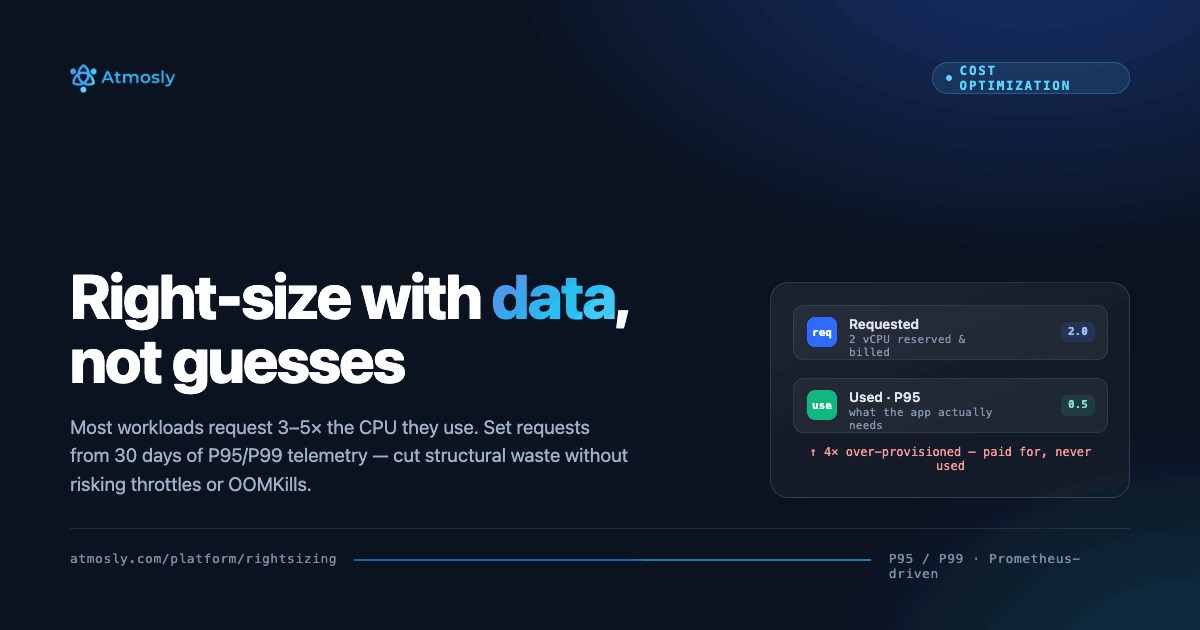
Principle 4: Data-Driven Decisions Over Gut Instinct
FinOps decisions must be based on actual utilization data, not assumptions. Developers often over-provision resources "to be safe" without measuring actual needs. FinOps requires collecting 30+ days of production telemetry, analyzing usage patterns at appropriate percentiles (P95/P99), and applying workload-specific safety buffers rather than arbitrary 3-5x over-provisioning.
Establishing Kubernetes Cost Visibility
Prerequisites: Prometheus and Metrics Collection
Kubernetes cost visibility requires telemetry infrastructure collecting resource utilization and allocation metrics. Most organizations already have Prometheus deployed for application monitoring, which provides the foundation for cost analysis:
Required Metrics (from kube-state-metrics, node-exporter, cAdvisor):
# Resource Requests and Limits
kube_pod_container_resource_requests{resource="cpu|memory"}
kube_pod_container_resource_limits{resource="cpu|memory"}

# Actual Usage
container_cpu_usage_seconds_total
container_memory_working_set_bytes

# Node Capacity and Allocatable
kube_node_status_allocatable{resource="cpu|memory"}
kube_node_labels  # For instance type, capacity type (spot/on-demand)

# Persistent Volumes
kube_persistentvolume_capacity_bytes
kube_persistentvolumeclaim_info
If Prometheus isn't deployed, install it first:
helm repo add prometheus-community https://prometheus-community.github.io/helm-charts
helm install prometheus prometheus-community/prometheus \
  --namespace monitoring \
  --create-namespace \
  --set server.retention=30d \
  --set server.persistentVolume.size=100Gi
Cost Allocation Methodology
1. Node Cost Allocation (Direct Compute)
Calculate per-pod cost based on resource requests as percentage of node capacity:
# Pod cost = (Pod CPU request / Node CPU capacity) × Node hourly cost
#          + (Pod Memory request / Node Memory capacity) × Node hourly cost

# Example:
# Node: m5.xlarge ($0.192/hour, 4 vCPU, 16 GB)
# Pod: 500m CPU, 1 GB memory requested

CPU_fraction = 0.5 cores / 4 cores = 12.5%
Memory_fraction = 1 GB / 16 GB = 6.25%
Average_fraction = (12.5% + 6.25%) / 2 = 9.375%

Pod_hourly_cost = $0.192 × 9.375% = $0.018/hour
Pod_monthly_cost = $0.018 × 730 hours = $13.14/month
2. Shared Infrastructure Cost Allocation
| Resource | Allocation Method | Rationale |
|---|---|---|
| Control Plane | Equal split across all namespaces | Benefits all workloads equally |
| Load Balancers | Proportional to ingress traffic | Direct usage correlation |
| Persistent Volumes | Direct attribution to claiming pod | Explicit ownership |
| Network Egress | Proportional to pod traffic | Direct usage correlation |
| Shared Services (monitoring, DNS) | Proportional to namespace resource requests | Proxy for consumption |
Implementing Cost Visibility with Atmosly
Rather than manually building cost allocation from Prometheus queries, Atmosly automates this by connecting to existing Prometheus:
How Atmosly Provides Cost Intelligence:
- Cluster Import: Connect your EKS/GKE/AKS cluster via import functionality (15 minutes)
- Prometheus Auto-Discovery: Atmosly detects existing Prometheus service and validates metrics
- 30-Day Data Ingestion: Pulls historical metrics automatically from Prometheus
- Cost Calculation: Computes per-pod, per-namespace, per-team monthly costs using cloud provider pricing
- Dashboard Generation: Provides instant cost visibility across all clusters
Atmosly Cost Intelligence Dashboard Shows:
- Total monthly Kubernetes spend with breakdown by namespace
- Cost trends over time (7-day, 30-day, 90-day views)
- Top 20 most expensive workloads with optimization potential
- Efficiency metrics (request-to-usage ratios identifying waste)
- Unused resources (orphaned volumes, idle nodes, stale preview environments)
- Projected monthly savings from rightsizing recommendations
Time Comparison:
- Manual approach (OpenCost, custom Grafana dashboards): 2-4 weeks setup
- Atmosly approach (connect Prometheus): 2 hours to full visibility
Tagging and Labeling Strategy
Three-Tier Label Schema
# Tier 1: Business Unit (top-level cost allocation)
kubectl label namespace payments business-unit=financial-services
kubectl label namespace analytics business-unit=data-platform

# Tier 2: Team (squad-level accountability)
kubectl label namespace payments team=payments-squad
kubectl label namespace fraud team=risk-squad

# Tier 3: Environment (prod vs non-prod segregation)
kubectl label namespace payments environment=production
kubectl label namespace payments-staging environment=staging

# Additional: Cost Center (finance reporting)
kubectl label namespace payments cost-center=engineering
kubectl label namespace compliance cost-center=legal
Enforcing Labels with Admission Controllers
Use OPA Gatekeeper or Kyverno to require cost allocation labels on all namespaces:
apiVersion: kyverno.io/v1
kind: ClusterPolicy
metadata:
  name: require-cost-labels
spec:
  validationFailureAction: enforce
  rules:
  - name: check-namespace-labels
    match:
      resources:
        kinds:
        - Namespace
    validate:
      message: "Namespace must have team, environment, and cost-center labels"
      pattern:
        metadata:
          labels:
            team: "?*"
            environment: "?*"
            cost-center: "?*"
Kubernetes FinOps Forecasting
Why Traditional Budgeting Fails for Kubernetes
Static annual budgets don't work for dynamic Kubernetes infrastructure:
- Traffic fluctuates seasonally (Black Friday, tax season, end-of-quarter)
- Product launches change resource requirements unpredictably
- Horizontal pod autoscaling adjusts capacity dynamically based on demand
- Development velocity impacts preview environment proliferation
- Optimization initiatives progressively reduce unit costs over time
Rolling 90-Day Forecast Model
Forecast Components:
- Historical Baseline: 90-day trailing average with seasonal adjustments
- Growth Trends: Month-over-month usage increase per namespace
- Product Roadmap: Known launches, migrations, or major features
- Optimization Pipeline: Scheduled rightsizing reducing unit costs
- Contingency Buffer: 10-15% padding for experimentation and unknowns
Example Forecast Calculation:
# Payments Namespace Forecast (Next 30 Days)

Baseline (90-day average): $8,200/month
Growth trend (15% MoM): +$1,230
Planned feature launch: +$1,800 (new payment provider integration)
Scheduled optimization: -$2,400 (rightsizing from Atmosly recommendations)
Contingency buffer (12%): +$1,060

Forecasted spend: $9,890/month
Confidence interval: ±$1,480 (±15%)
Range: $8,410 - $11,370/month
Update Frequency and Variance Tracking
- Update cadence: Monthly (beginning of each month)
- Variance review: Weekly comparison of actual vs forecast
- Reforecast trigger: Actual spend deviates >20% from forecast
- Acceptable variance: ±10-15% for mature FinOps practices
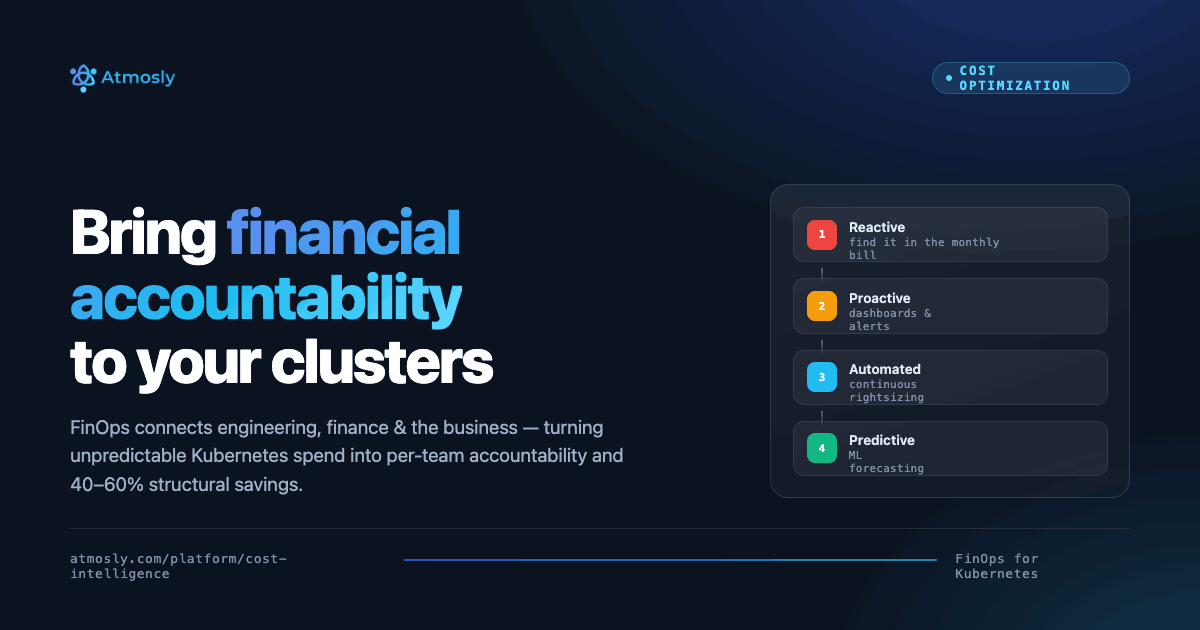
Kubernetes FinOps Maturity Model
Stage 1: Reactive ("We Have a Cost Problem")
Characteristics:
- Finance alerts engineering that cloud bill exceeded budget by 40%
- No cost visibility tools—engineers manually inspect AWS Cost Explorer
- Optimization is ad-hoc firefighting during budget crises
- No tagging or labeling standards for cost allocation
- Teams blame each other for overspend without data
Metrics:
- Mean time to detect cost anomaly: 30-60 days (monthly bill discovery)
- Forecast accuracy: ±40-60% variance
- Resource utilization: 25-35% (massive over-provisioning)
- Engineering time on cost: 40+ hours/month (reactive cleanup)
Stage 2: Proactive ("We Can See Our Costs")
Characteristics:
- Cost monitoring deployed (OpenCost, Kubecost, or Atmosly connected to Prometheus)
- Basic namespace labeling for cost attribution
- Monthly FinOps review meetings identifying optimization opportunities
- Engineers have dashboard access but optimization mostly manual
- Quarterly rightsizing initiatives cleaning up obvious waste
Metrics:
- Mean time to detect cost anomaly: 7-14 days
- Forecast accuracy: ±20-30% variance
- Resource utilization: 40-55%
- Engineering time on cost: 15-25 hours/month
Stage 3: Automated ("Cost Optimization Is Built-In")
Characteristics:
- Automated rightsizing recommendations from Atmosly or similar platforms
- CI/CD pipelines show cost impact on every pull request
- Policy-as-code prevents wasteful configurations before production
- Scheduled cleanup automation (preview environments, unused volumes)
- Cost efficiency metrics in team OKRs alongside velocity and reliability
Metrics:
- Mean time to detect cost anomaly: 30 minutes (real-time alerts)
- Forecast accuracy: ±10-15% variance
- Resource utilization: 60-70%
- Engineering time on cost: 5-10 hours/month (reviewing recommendations)
Stage 4: Predictive ("AI Optimizes Continuously")
Characteristics:
- ML models predict resource needs based on historical patterns and business metrics
- Automatic detection and remediation of cost anomalies
- Forecasts incorporate product roadmap and seasonal factors
- Cost efficiency as reliable as uptime SLOs
- FinOps recognized as strategic business advantage
Metrics:
- Mean time to detect cost anomaly: Real-time (<5 minutes)
- Forecast accuracy: ±8-12% variance
- Resource utilization: 70-80% (optimal with safety buffers)
- Engineering time on cost: 2-5 hours/month (strategic decisions only)

Automation Opportunities
1. Automated Rightsizing with Atmosly
Rightsizing is the highest-ROI FinOps lever — for the full methodology (P95/P99 analysis, safety buffers, staged rollout) see our dedicated guide to right-sizing Kubernetes workloads.
Instead of manually querying Prometheus and calculating P95/P99 utilization per workload:
- Atmosly connects to existing Prometheus and ingests 30 days of metrics
- ML engine analyzes usage patterns across all pods automatically
- Generates per-workload rightsizing recommendations with safety buffers
- Calculates monthly cost savings per recommendation
- Provides Kubernetes YAML patches ready to apply
- Result: 95% less manual effort, recommendations in 2 hours vs 2 weeks
2. Idle Resource Detection and Cleanup
# Detect preview environments idle >7 days
apiVersion: batch/v1
kind: CronJob
metadata:
  name: cleanup-idle-previews
spec:
  schedule: "0 2 * * *"  # Daily at 2 AM
  jobTemplate:
    spec:
      template:
        spec:
          containers:
          - name: cleanup
            image: bitnami/kubectl
            command:
            - /bin/sh
            - -c
            - |
              # Delete namespaces with label environment=preview, no traffic >7 days
              kubectl get ns -l environment=preview -o json | \
              jq -r '.items[] | select(.metadata.annotations."last-traffic" | fromdateiso8601 < (now - 604800)) | .metadata.name' | \
              xargs -r kubectl delete ns
3. CI/CD Cost Impact Checks
Integrate cost analysis into pull request workflows:
# GitHub Actions: Atmosly Cost Check
name: Cost Impact Analysis
on: [pull_request]

jobs:
  cost-check:
    runs-on: ubuntu-latest
    steps:
      - uses: actions/checkout@v3

      - name: Analyze Resource Changes
        run: |
          # Compare manifests in PR vs main branch
          git diff origin/main HEAD -- k8s/ > changes.diff

      - name: Calculate Cost Impact
        run: |
          # Extract resource request changes
          # Calculate projected monthly cost delta
          # Post comment to PR with analysis

# Example PR Comment:
# 💰 Cost Impact: +$167/month (+68%)
# ⚠️ Consider horizontal scaling instead of vertical
Organizational Change Management
Common Resistance and Solutions
Resistance 1: "Cost optimization slows innovation"
- Reality: FinOps enables innovation by preventing budget exhaustion mid-year
- Solution: Frame as efficiency (doing more with same budget) not restriction
Resistance 2: "Engineers shouldn't worry about costs"
- Reality: Engineers make deployment decisions with 3-5 year financial impact
- Solution: Provide tools and visibility, not blame; celebrate optimization wins
Resistance 3: "Too complex for non-finance people"
- Reality: Engineers understand resource utilization; cost is just another metric
- Solution: Translate financial metrics to engineering language ($/pod, efficiency %)
Building FinOps Culture
- Lead by Example: Platform team demonstrates cost optimization in their own services
- Celebrate Wins: Public recognition for teams reducing waste (Slack shoutouts, all-hands mentions)
- Make It Easy: Automated recommendations vs manual analysis
- Avoid Punishment: Treat overspend as learning opportunity, not failure
- Include in OKRs: Cost efficiency alongside velocity and reliability metrics
Getting Started: 30-Day FinOps Roadmap
Week 1: Establish Visibility
- Verify Prometheus deployed with 30+ days retention
- Import cluster into Atmosly (or deploy OpenCost for manual approach)
- Label all namespaces with team, environment, cost-center
- Review initial cost breakdown dashboard
- Identify top 5 most expensive namespaces
Week 2: Quick Wins
- Delete obviously unused resources (abandoned preview environments)
- Clean up orphaned persistent volumes not attached to pods
- Implement preview environment auto-delete after 7 days idle
- Review top 10 over-provisioned workloads from Atmosly recommendations
- Apply rightsizing to 3-5 staging workloads as proof-of-concept
Week 3: Organizational Foundation
- Form FinOps working group (platform eng, product eng, finance)
- Define cost allocation standards and labeling policies
- Create 90-day rolling forecast for top 5 namespaces
- Present cost visibility dashboard to engineering leadership
- Schedule weekly 15-minute FinOps check-in meetings
Week 4: Automation and Scale
- Implement admission controller enforcing cost labels on new namespaces
- Add cost impact analysis to CI/CD pipeline (GitHub Actions, GitLab CI)
- Deploy automated cleanup policies (idle resources, unused volumes)
- Roll out rightsizing recommendations to top 20 workloads
- Publish first monthly FinOps report showing savings and trends
Conclusion: FinOps as Competitive Advantage
Kubernetes FinOps transforms infrastructure cost from uncontrolled liability to strategic asset. Organizations with mature FinOps practices achieve 40-60% cost reduction while improving reliability through better resource management, faster innovation through budget predictability, and stronger engineering culture through shared accountability.
The journey from reactive to predictive FinOps takes 6-12 months but delivers compounding returns: initial visibility drives voluntary cleanup (5-10% savings), systematic rightsizing reclaims over-provisioned resources (20-30% savings), automation prevents cost regression (sustained efficiency), and cultural embedding makes cost optimization continuous rather than episodic.
Start with visibility this week. Connect your Prometheus to Atmosly or deploy OpenCost for namespace-level cost attribution. You'll discover optimization opportunities within hours that would take weeks of manual Prometheus analysis. Build from there with labeling standards, automated recommendations, CI/CD integration, and organizational practices that make FinOps as natural as monitoring latency or error rates.
Related Guides
- Right-Sizing Kubernetes Workloads: Data-Driven Approach — the deep-dive on the single biggest FinOps lever.
- Cut Kubernetes Costs: Best Cloud Cost-Optimization Strategies — tactical savings (spot, autoscaling, storage).
- Atmosly Cost Intelligence — automated cost allocation and rightsizing on your existing Prometheus.
Ready to start your FinOps journey? Import your clusters into Atmosly and get cost visibility in 2 hours. Atmosly connects to your existing Prometheus, analyzes 30 days of metrics, and delivers rightsizing recommendations with projected savings.
Questions about FinOps implementation? Schedule a consultation with our solutions team to discuss your specific infrastructure and goals.