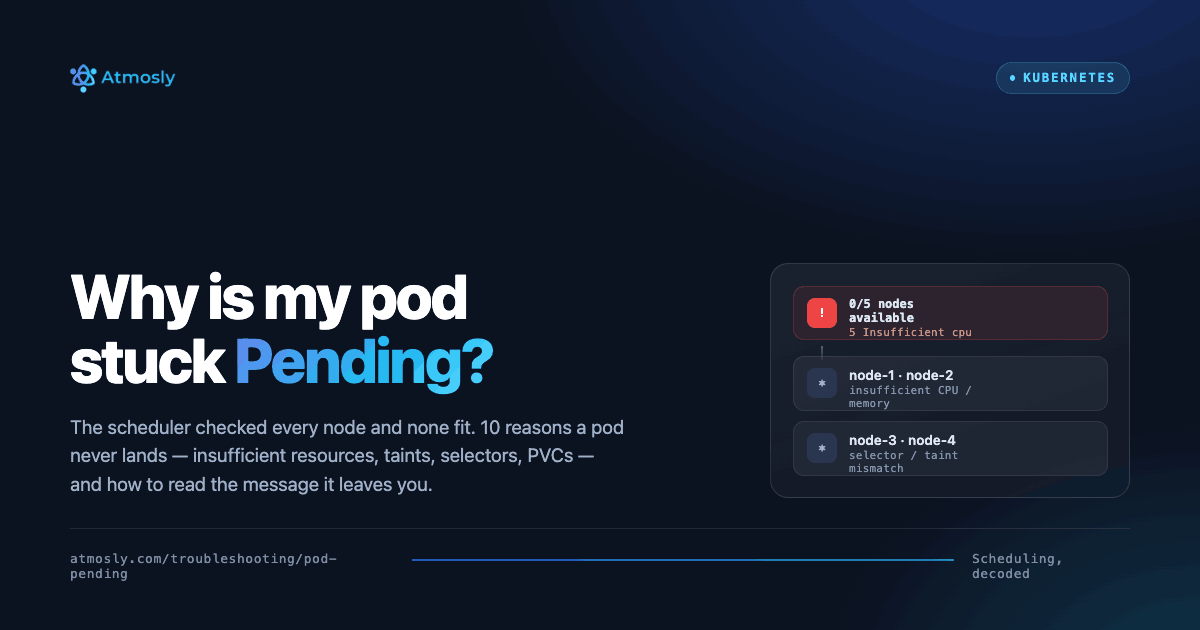
.png)
Introduction
Kubernetes is a powerful container orchestration platform, but monitoring its health and performance can be challenging. Kube Prometheus Stack simplifies this by offering a pre-configured monitoring solution that includes Prometheus, Alertmanager, Grafana, and various exporters.
In this guide, we???ll explore how to install, configure, and optimize Kube Prometheus Stack for Kubernetes monitoring. Additionally, we???ll discuss best practices for improving observability in production environments.
What is Kube Prometheus Stack?
The Kube Prometheus Stack is a preconfigured bundle of monitoring tools designed for Kubernetes environments. It includes :
Prometheus: Collects metrics from Kubernetes clusters.
- Alertmanager: Handles alert notifications.
- Grafana: Provides visualization dashboards.
Node Exporter & Kube State Metrics: Collect system and Kubernetes metrics.

Why Use Kube Prometheus Stack for Kubernetes Monitoring?
- Preconfigured Setup for Kubernetes Monitoring
Setting up Kubernetes monitoring manually can be complex. Kube Prometheus Stack comes with preconfigured components like Prometheus, Grafana, and Alertmanager, making it easy to deploy and start monitoring your cluster right away. - Extensive Dashboards with Grafana
Grafana provides ready-to-use dashboards that display critical Kubernetes metrics such as CPU, memory, network usage, and pod health. Instead of building custom dashboards from scratch, you can quickly import and visualize key performance data. - Automatic Alerting for System Health
The built-in Alertmanager helps detect and notify teams about critical issues, such as high CPU usage, failing pods, or low memory. Alerts can be sent via Slack, PagerDuty, Email, or other notification systems, enabling quick issue resolution. - Scalable Monitoring for Production Workloads
Designed for high availability and scalability, the Kube Prometheus Stack can handle large Kubernetes clusters. It supports multiple Prometheus instances, configurable retention policies, and persistent storage, ensuring reliability even as workloads grow.
With Atmosly, you can enable the Kube Prometheus Stack as an option while creating a Kubernetes cluster. This means monitoring is pre-configured from Day 0, reducing manual setup and ensuring instant observability.
How to Install Kube Prometheus Stack With Helm
There are multiple ways to deploy Kube Prometheus Stack, but the easiest method is using Helm.
Prerequisites
- A running Kubernetes cluster (EKS, AKS, GKE, or self-hosted).
- Helm package manager installed.
Step-by-Step Installation
Step 1. Add the Prometheus Community Helm Repository
helm repo add prometheus-community https://prometheus-community.github.io/helm-charts
helm repo update
Step 2. Install Kube Prometheus Stack
This will deploy Prometheus, Grafana, Alertmanager, and other monitoring components in the monitoring namespace.
Step 3. Verify InstallationYou should see multiple running pods like prometheus-kube-stack, grafana, alertmanager, etc.
Some platforms, like Atmosly, offer automated installation and pre-configured dashboards for seamless Kubernetes monitoring.
Accessing Prometheus, Grafana, and Alertmanager Dashboards
1. Get Prometheus URL
kubectl port-forward svc/kube-prometheus-stack-prometheus 9090 -n monitoring
Access Prometheus via: http://localhost:9090
2. Get Grafana URL & Login
kubectl port-forward svc/kube-prometheus-stack-grafana 3000 -n monitoring
Access Grafana via: http://localhost:3000
Default Username/Password: admin/prom-operator
Instead of setting up Grafana manually, Atmosly provides pre-built monitoring dashboards from Day 0, allowing you to visualize cluster performance instantly.
Configuring Dashboards and Alerts in Grafana
1. Importing Grafana Dashboards
- Navigate to Grafana > Dashboards > Import
- Use ID 6417 (Prebuilt Kubernetes Dashboard)
- Select Prometheus as the data source
2. Setting Up Custom Alerts
You can configure alerts in Alertmanager for issues like high CPU usage, low memory, or failing pods.
Example Alert Rule
groups:
  - name: HighCPUUsage
    rules:
      - alert: HighCPUUsage
        expr: instance:node_cpu_utilisation:rate5m > 0.9
        for: 2m
        labels:
          severity: warning
        annotations:
          summary: "High CPU Usage detected"
Apply the alert:
Scaling & Optimizing Kube Prometheus Stack For Production
1. Managing Retention & Storage
By default, Prometheus stores data in memory, which can lead to resource issues. To optimize it:
helm upgrade kube-prometheus-stack prometheus-community/kube-prometheus-stack \
--set prometheus.prometheusSpec.retention=30d \
--set prometheus.prometheusSpec.storageSpec.volumeClaimTemplate.spec.resources.requests.storage=50Gi -n monitoring
This increases data retention to 30 days and allocates 50Gi of storage.
2. High Availability Setup
For HA mode, deploy multiple instances:With Atmosly, you don???t need to manually tweak storage or HA settings. The platform automatically configures and scales your monitoring stack based on your cluster size.
Best Practices for Kube Prometheus Stack
Implementing the Kube Prometheus Stack effectively requires proper configuration and optimization. Here are some best practices to ensure a robust and scalable Kubernetes monitoring setup:
Use Persistent Storage to Avoid Data Loss:
By default, Prometheus stores data in memory, meaning a pod restart could erase historical metrics. Use Persistent Volumes (PVs) to retain monitoring data across pod restarts and failures.
Optimize Retention Period Based on Available Disk Space:
Prometheus retains data for a default period (usually 15 days). If your infrastructure has limited storage, adjust the retention period and storage allocation accordingly.
Enable High Availability (HA) for Fault Tolerance in Production:
In production environments, a single Prometheus instance can become a single point of failure. Deploying multiple replicas improves resilience.
Use Grafana Dashboards to Visualize Key Metrics:
Grafana provides pre-built dashboards for Kubernetes monitoring. Instead of manually creating visualizations, import a ready-made dashboard (like ID 6417 from Grafana???s repository) for instant insights.
Set Up External Alerting (Slack, PagerDuty, or Email):
Alertmanager can notify DevOps teams about cluster health issues via external services like Slack, PagerDuty, or Email. Configure alerting rules in alert-rules.yaml and integrate with your preferred notification channel.
Conclusion
The Kube Prometheus Stack delivers everything you need for complete Kubernetes observability real-time metrics, customizable Grafana dashboards, and proactive alerting. Whether you???re managing a small cluster or a large-scale production environment, it offers scalability, reliability, and performance insight out of the box.
With Atmosly, you can skip the manual setup entirely. Enable Kube Prometheus Stack during cluster creation and start monitoring from Day 0 with automated dashboards, integrated alerts, and full-scale observability built right in.
Try Atmosly today and simplify Kubernetes monitoring for your DevOps teams.