Introduction to Kubernetes Pod Pending State: When Scheduling Fails
A Kubernetes pod stuck in Pending state is one of the most common operational issues that prevents applications from running, manifesting when the Kubernetes scheduler cannot find a suitable node to run your pod, leaving it indefinitely waiting for resources that may never become available. Unlike CrashLoopBackOff where your container starts but crashes, or ImagePullBackOff where the image cannot be pulled, Pending status occurs even earlier in the pod lifecycle—before the pod is even assigned to a node and before Kubernetes attempts to pull images or start containers. The pod exists as a Kubernetes API object with desired state defined in your deployment specification, but it cannot transition from desired state to actual running state because the scheduler cannot satisfy the pod's requirements using available cluster resources and constraints.
Understanding why pods get stuck Pending requires understanding how the Kubernetes scheduler works: when a pod is created, it enters the scheduling queue, the scheduler evaluates every node in the cluster checking if the node has sufficient unreserved (allocatable minus sum of requests) CPU and memory to accommodate the pod's resource requests, whether the node matches any nodeSelector or affinity rules defined in the pod spec, whether the node has any taints that the pod doesn't tolerate, whether required PersistentVolumes are available and can be mounted on that node, whether the node is in Ready state and accepting pods, and scoring nodes that pass all predicates to select the optimal placement, then binding the pod to the chosen node by updating the pod's spec.nodeName field. If no nodes pass all these checks, the pod remains unscheduled in Pending state indefinitely, and the scheduler periodically retries but keeps failing for the same reasons until you either fix the underlying problem, add nodes with required resources and characteristics, or modify the pod spec to be less demanding.
The consequences of Pending pods range from development annoyances to critical production outages: in development, a Pending pod usually just means you need to add a node to your local cluster or reduce resource requests in your test deployment, causing minor inconvenience. In production, Pending pods can cause deployment failures where new versions never roll out because new pods can't be scheduled while old pods keep running, autoscaling failures where HPA cannot scale up during traffic spikes because new replicas remain Pending leaving insufficient capacity to handle load, disaster recovery failures after node failures where pods cannot be rescheduled to surviving nodes due to resource constraints, and complete service unavailability if all existing pods are deleted during a deployment that then fails to schedule new pods, leaving zero running instances and broken service for customers.
This comprehensive guide provides complete understanding of Pod Pending issues and their solutions, covering: what Pending status means technically and how it differs from other pod states, the complete Kubernetes scheduling process from pod creation through node selection and binding, the 10 most common reasons pods remain Pending with specific symptoms and diagnostic indicators for each reason, systematic debugging methodology using kubectl commands to identify why scheduling failed, understanding resource requests versus limits and how they affect scheduling decisions, node capacity, allocatable resources, and reservation calculations, troubleshooting node selector and affinity rules that prevent scheduling, handling node taints and tolerations, resolving PersistentVolume binding issues, fixing resource quota violations, understanding QoS (Quality of Service) classes and eviction priority, and how Atmosly's intelligent scheduling analysis automatically detects Pending pods within 2 minutes, analyzes ALL nodes in the cluster identifying specifically why each node rejected the pod (insufficient CPU on node-1, insufficient memory on node-2, missing GPU on node-3, taint blocking on node-4), calculates exactly how much additional capacity needed or what configuration changes required, and recommends optimal solutions with specific kubectl commands to either adjust pod resource requests to fit existing nodes, trigger cluster autoscaling to add appropriately sized nodes, remove overly restrictive node selectors or affinity rules, or add tolerations for tainted nodes—reducing investigation time from 20-45 minutes of manual node inspection and capacity calculations to immediate diagnosis with actionable next steps.
By mastering Pod Pending troubleshooting through this guide, you'll be able to diagnose scheduling failures in minutes, understand cluster capacity planning to prevent Pending pods, implement proper resource requests avoiding both under-provisioning (Pending pods) and over-provisioning (wasted money), configure node selectors and affinity rules correctly, and leverage AI-powered tools to automate capacity analysis entirely.
What Does Pod Pending Mean? Scheduling Deep Dive
Understanding the Pending Phase
Pending is one of five pod phases in Kubernetes lifecycle. A pod in Pending state means:
- ✅ Pod has been accepted by Kubernetes API server (pod object exists)
- ✅ Pod specification validated (YAML is correct)
- ❌ Pod has NOT been scheduled to a node yet (spec.nodeName is empty)
- ❌ OR pod is scheduled but container images are being pulled
- ❌ Containers are NOT running
Two sub-states of Pending:
- Unscheduled Pending: spec.nodeName is empty, scheduler hasn't found suitable node. This is the focus of this guide.
- Scheduled but Not Running Pending: spec.nodeName is set (assigned to node), but containers not yet started (usually pulling images or waiting for volumes). This transitions to Running once containers start, or ImagePullBackOff if pull fails.
The Kubernetes Scheduling Process Explained
When you create a pod, the Kubernetes scheduler performs this workflow:
Phase 1: Filtering (Predicates)
Scheduler evaluates each node checking predicates (hard constraints):
- PodFitsResources: Does node have enough unreserved CPU and memory to accommodate pod's requests?
- PodFitsHostPorts: Are required hostPorts available on this node?
- MatchNodeSelector: Does node match pod's nodeSelector labels?
- MatchNodeAffinity: Does node satisfy requiredDuringSchedulingIgnoredDuringExecution affinity?
- PodToleratesNodeTaints: Can pod tolerate all of node's taints?
- VolumeZoneConflict: Are required PVs available in node's zone?
- NoVolumeNodeConflict: Can all required volumes be mounted on this node?
- CheckNodeMemoryPressure/CheckNodeDiskPressure: Is node under resource pressure?
- CheckNodePIDPressure: Does node have available process IDs?
Nodes failing ANY predicate are eliminated from consideration.
Phase 2: Scoring (Priorities)
For nodes passing all predicates, scheduler scores based on priorities:
- Spread pods across nodes for availability
- Pack pods on same node for efficiency (fewer nodes)
- Prefer nodes with images already cached
- Consider inter-pod affinity/anti-affinity
Phase 3: Binding
Highest-scored node is selected, pod bound by setting spec.nodeName.
If no nodes pass predicates: Pod remains Pending.

The 10 Most Common Reasons for Pod Pending
Reason 1: Insufficient CPU or Memory on All Nodes
Most common cause of Pending pods
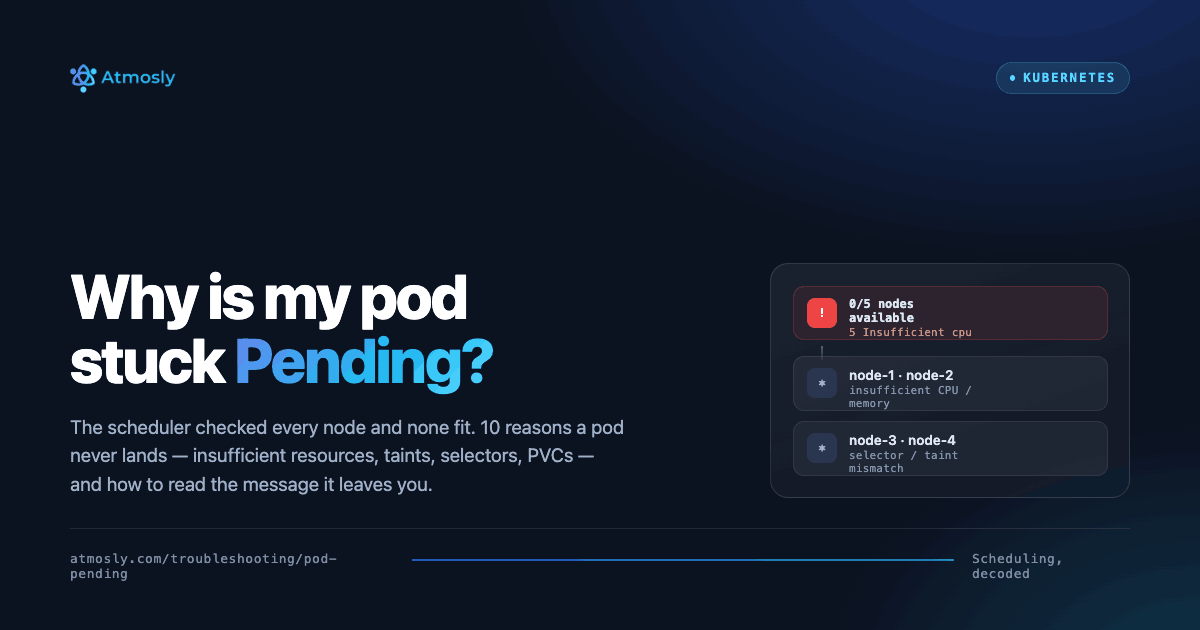
Symptoms: Scheduler events show "0/N nodes available: N Insufficient cpu" or "Insufficient memory"
How to diagnose:
# Check scheduler events
kubectl describe pod my-pod

# Events show:
# 0/5 nodes are available: 5 Insufficient cpu
# Means: All 5 nodes lack sufficient CPU

# Check pod's resource requests
kubectl get pod my-pod -o jsonpath='{.spec.containers[*].resources.requests}'
# Output: {"cpu":"4","memory":"8Gi"}

# Check node capacity and allocatable
kubectl describe nodes | grep -A 5 "Allocated resources"

# Example node output:
# Allocated resources:
#   CPU Requests:  3900m (97% of 4000m allocatable)
#   Memory Requests: 7.5Gi (93% of 8Gi allocatable)
# This node cannot fit pod requesting 4 CPU (only 100m available)
Solutions:
# Solution 1: Reduce pod resource requests
kubectl set resources deployment/my-app \\
  --requests=cpu=1,memory=2Gi

# Solution 2: Add nodes to cluster (autoscaling)
# For EKS:
eksctl scale nodegroup --cluster=my-cluster --name=my-ng --nodes=8

# For GKE:
gcloud container clusters resize my-cluster --num-nodes=8

# For AKS:
az aks scale --resource-group myRG --name myCluster --node-count 8

# Solution 3: Delete unused pods to free resources
kubectl delete pod unused-pod
Atmosly's Analysis:
Pod Pending: Insufficient Resources
Pod: data-processing-job-xyz
Requested: 4 CPU, 8Gi memory
Status: Pending for 8 minutesScheduler Analysis:
- Total nodes: 5
- Node-1: 3.2 CPU available (need 4 - INSUFFICIENT)
- Node-2: 5 CPU available BUT only 6Gi memory (need 8Gi - INSUFFICIENT)
- Node-3: 3.8 CPU available (INSUFFICIENT)
- Node-4: Tainted dedicated=gpu:NoSchedule (pod lacks toleration - BLOCKED)
- Node-5: 4.5 CPU, 9Gi memory BUT already running max pods (110/110 - FULL)
Root Cause: No single node has both 4 CPU AND 8Gi memory available simultaneously
Recommended Solutions:
- Reduce requests to fit Node-2:
kubectl set resources job/data-processing --requests=cpu=2,memory=4Gi(job will run on Node-2)- Trigger autoscaling: Add c5.2xlarge node (8 CPU, 16Gi) via cluster autoscaler
- Use Node-4: Add toleration for dedicated=gpu taint if GPU not actually needed:
tolerations: - key: dedicated operator: Equal value: gpu effect: NoSchedule- Increase max pods on Node-5: kubelet --max-pods=150 (requires node configuration change)
Cost-optimal solution: #1 (reduce requests) - zero additional cost
Fastest solution: #2 (autoscale) - new node ready in 3-5 minutes
Reason 2: Node Selector or Node Affinity Not Matched
Symptoms: Scheduler events show "0/N nodes are available: N node(s) didn't match Pod's node affinity/selector."
How to diagnose:
# Check the pod's nodeSelector and affinity
kubectl get pod my-pod -o jsonpath='{.spec.nodeSelector}'
# Output: {"disktype":"ssd","zone":"us-east-1a"}

# List node labels to see what actually exists
kubectl get nodes --show-labels

# Confirm no node carries the required label
kubectl get nodes -l disktype=ssd
# (empty output = no node matches -> pod stays Pending)
Solutions:
# Solution 1: Label a node so it matches the selector
kubectl label node ip-10-0-1-20 disktype=ssd

# Solution 2: Remove or loosen an overly strict selector
kubectl patch deployment my-app --type=json \
  -p='[{"op":"remove","path":"/spec/template/spec/nodeSelector"}]'

# Solution 3: Convert hard requiredDuringScheduling affinity to
# preferredDuringScheduling so the scheduler can fall back to any node
Reason 3: Pod Affinity / Anti-Affinity Unsatisfied
Symptoms: Events show "node(s) didn't match pod affinity rules" or "node(s) didn't satisfy existing pods anti-affinity rules."
How to diagnose:
# Inspect affinity rules
kubectl get pod my-pod -o yaml | grep -A 20 affinity

# Common causes:
# - topologyKey references a label nodes don't have (e.g. topology.kubernetes.io/zone)
# - requiredDuringScheduling anti-affinity wants 1 pod per node but
#   replicas > nodes, so later replicas can't be placed
kubectl get nodes -o json | jq '.items[].metadata.labels'
Solutions: Relax requiredDuringSchedulingIgnoredDuringExecution to preferredDuringScheduling...; ensure the pods you want to co-locate actually exist and are Running; verify the topologyKey label is present on every node; or add more nodes so anti-affinity ("one replica per node") can be satisfied.
Reason 4: Node Taints Blocking Scheduling
Symptoms: Events show "X node(s) had untolerated taint {key: value}". A classic case is pods that won't schedule onto control-plane nodes (node-role.kubernetes.io/control-plane:NoSchedule) or onto spot/GPU nodes that were deliberately tainted.
# Find every node taint
kubectl describe nodes | grep -i Taints
# node-1: dedicated=gpu:NoSchedule
# node-2: spot=true:NoSchedule

# Add a matching toleration to the pod spec
tolerations:
- key: "dedicated"
  operator: "Equal"
  value: "gpu"
  effect: "NoSchedule"

# ...or remove the taint entirely (note the trailing dash)
kubectl taint nodes node-1 dedicated=gpu:NoSchedule-
Reason 5: PersistentVolumeClaim Not Available or Unbound
Symptoms: Pod stays Pending while its PVC is also Pending, or events show "node(s) had volume node affinity conflict."
# Check PVC status
kubectl get pvc
# NAME        STATUS    VOLUME   CAPACITY   STORAGECLASS
# data-pvc    Pending                       gp3

kubectl describe pvc data-pvc
# Common messages:
# - "no persistent volumes available for this claim and no storage class is set"
# - "waiting for first consumer to be created before binding" (WaitForFirstConsumer)
# - zone mismatch: PV in us-east-1a, pod scheduled to us-east-1b
Solutions: Set a valid storageClassName with a working dynamic provisioner; for static PVs, create a PV that matches the claim's size/access mode; for WaitForFirstConsumer volumes ensure the pod's node and the volume land in the same zone; confirm the CSI driver pods are healthy.
Reason 6: Resource Quota Exceeded
Symptoms: The pod (or its ReplicaSet) is never even created and you see "exceeded quota" in the controller events, or pods are rejected for "must specify limits.cpu" when a quota requires limits.
# Inspect namespace quotas
kubectl get resourcequota -n my-namespace
kubectl describe resourcequota -n my-namespace
# Used vs Hard: requests.cpu  19/20   requests.memory 38Gi/40Gi

# Why it blocks scheduling:
# - Namespace is at its CPU/memory request ceiling
# - Quota requires requests AND limits but the pod omits them
Solutions: Raise the quota (kubectl edit resourcequota), delete unused workloads in the namespace to free quota, or add explicit requests/limits to the pod spec so it satisfies the quota's requirements.
Reason 7: Too Many Pods on Nodes (max-pods / IP exhaustion)
Symptoms: Events show "Too many pods" even though CPU and memory look free. Every node has hit its pod cap (commonly 110, or lower on EKS where it is bounded by ENI IP capacity per instance type).
# Check pod capacity vs allocatable per node
kubectl describe node ip-10-0-1-20 | grep -A3 "Allocatable"
#   pods: 110
kubectl get pods --all-namespaces -o wide | grep ip-10-0-1-20 | wc -l
# 110  -> node is full on pod count, not CPU/memory
Solutions: Add nodes; raise the kubelet --max-pods (requires node config change); on EKS enable VPC CNI prefix delegation to raise the per-node IP/pod ceiling, or use larger instance types with more ENIs.
Reason 8: Node Conditions — DiskPressure, MemoryPressure, or NotReady
Symptoms: Events show "node(s) had condition: DiskPressure" / "MemoryPressure", or all nodes are NotReady so the scheduler has nothing to place onto.
kubectl get nodes
# NAME            STATUS     ROLES
# ip-10-0-1-20    NotReady

kubectl describe node ip-10-0-1-20 | grep -A8 Conditions
# DiskPressure   True   kubelet has disk pressure
# Ready          False  kubelet stopped posting status
Solutions: Free node disk (prune images/logs: crictl rmi --prune), resolve the kubelet/CNI failure causing NotReady, or cordon and replace the unhealthy node. Once the condition clears the scheduler will place the pod automatically.
Reason 9: Topology Spread Constraints Unsatisfiable
Symptoms: Events show "node(s) didn't match pod topology spread constraints." A maxSkew with whenUnsatisfiable: DoNotSchedule prevents placement when no node keeps the spread within the allowed skew.
kubectl get pod my-pod -o yaml | grep -A8 topologySpreadConstraints
# maxSkew: 1
# topologyKey: topology.kubernetes.io/zone
# whenUnsatisfiable: DoNotSchedule
# -> only 2 zones have nodes, so the 3rd replica can't keep skew <= 1
Solutions: Switch whenUnsatisfiable to ScheduleAnyway, add nodes in the under-represented topology (e.g. a third AZ), increase maxSkew, or confirm every node carries the topologyKey label.
Reason 10: Scheduler Not Running or Pod Priority/Preemption
Symptoms: The pod is Pending with no scheduling events at all (the scheduler isn't running, or the pod's schedulerName points at a scheduler that doesn't exist), or a low-priority pod is repeatedly preempted by higher-priority workloads.
# Is the scheduler healthy?
kubectl get pods -n kube-system | grep scheduler
kubectl logs -n kube-system kube-scheduler- | tail

# Does the pod request a custom scheduler that isn't deployed?
kubectl get pod my-pod -o jsonpath='{.spec.schedulerName}'

# Priority/preemption context
kubectl get priorityclass
kubectl get pod my-pod -o jsonpath='{.spec.priorityClassName}'
Solutions: Restart or repair kube-scheduler; make sure a custom schedulerName matches a running scheduler; assign an appropriate PriorityClass so critical pods can preempt lower-priority ones instead of waiting.
Complete Debugging Guide for Pending Pods
Use this systematic workflow to diagnose any Pending pod in minutes:
# 1. Read the scheduler's own explanation (the single most useful command)
kubectl describe pod my-pod
#    -> the Events section names the exact predicate that failed,
#       e.g. "0/5 nodes are available: 3 Insufficient cpu,
#       2 node(s) had untolerated taint"

# 2. See the pod's demands
kubectl get pod my-pod -o jsonpath='{.spec.containers[*].resources.requests}'
kubectl get pod my-pod -o yaml | grep -E "nodeSelector|affinity|tolerations|topologySpread" -A3

# 3. See what the cluster can actually offer
kubectl describe nodes | grep -A5 "Allocated resources"
kubectl get nodes --show-labels

# 4. Check the supporting objects
kubectl get pvc
kubectl get resourcequota -n my-namespace

# 5. If there are NO events at all, suspect the scheduler
kubectl get pods -n kube-system | grep scheduler
The decode key is the message after "0/N nodes are available": Insufficient cpu/memory → Reason 1, didn't match node selector/affinity → Reason 2/3, untolerated taint → Reason 4, volume node affinity conflict → Reason 5, Too many pods → Reason 7, had condition → Reason 8, didn't match topology spread → Reason 9.
Understanding Resource Requests and Scheduling
The scheduler places pods using requests, not actual usage and not limits. A node's schedulable capacity is its allocatable value (total capacity minus kube/system-reserved), and a pod fits only if its CPU and memory requests are both less than the unreserved allocatable remaining on some single node.
# Allocatable = Capacity - kube-reserved - system-reserved - eviction-threshold
kubectl describe node ip-10-0-1-20 | grep -A6 Allocatable

# A node with 4000m allocatable CPU already running 3900m of requests
# has only 100m left - a pod requesting 500m cannot fit, even if the
# node's REAL CPU usage is near idle.
This is why over-requesting causes a double problem: pods get stuck Pending and you pay for reserved capacity you never use. The fix is data-driven requests based on real P95/P99 usage — see our guide to right-sizing Kubernetes workloads. Pending caused by genuine over-requesting is one of the most common — and most avoidable — scheduling failures.
How Atmosly Analyzes Pending Pods
Manually inspecting every node's allocatable capacity, taints, labels, and PVC zones is slow — often 20–45 minutes per incident. Atmosly's AI SRE agent automates the entire investigation:
- Detects any pod Pending beyond a configurable threshold (default 2 minutes) and separates unschedulable Pending from image-pull Pending.
- Explains every node — for each node it states the specific reason the pod was rejected (insufficient CPU on node-1, missing label on node-2, untolerated taint on node-3, max-pods reached on node-4).
- Calculates the gap — exactly how much additional CPU/memory is needed, or which constraint to relax.
- Recommends the optimal fix with the cost trade-off (reduce requests = $0; add a c5.2xlarge node ≈ $120/month) and the exact
kubectlcommand to apply it.
It connects to your existing Prometheus and cluster — no new agents per workload — turning a 30-minute manual hunt into a 30-second answer. The same engine also powers Atmosly's Cost Intelligence, so the rightsizing it recommends to clear a Pending pod also reduces waste cluster-wide.
Related Guides
- How to Fix Kubernetes OOMKilled Errors — the memory-limit failure mode.
- CrashLoopBackOff: Causes & Solutions — when the pod schedules but won't stay up.
- ImagePullBackOff: Complete Fix Guide — when the image can't be pulled.
- Atmosly AI SRE Agent — automated root-cause analysis for Kubernetes.
Conclusion
Pod Pending means scheduler cannot find suitable node. Common causes: insufficient resources, node selector mismatch, taints, PVC unavailable. Fix by adjusting requests, adding nodes, removing constraints, or adding tolerations.
Ready to diagnose Pending pods instantly? Start your free Atmosly trial for AI-powered scheduling analysis.