The network line item on a Kubernetes bill is the one that surprises teams most often. Compute is predictable because you can see the nodes; storage is predictable because you can see the PVCs; network charges accumulate from traffic patterns that nobody explicitly designed and that are invisible from inside the cluster. A service that was architected for a single-cluster world starts calling a replica in a different zone after a routine rebalance, and nobody notices until the monthly egress bill is three times what it was last quarter. Kubernetes network cost optimization is the discipline of making those invisible flows visible, understanding which ones map to real traffic charges, and reducing them without breaking the architecture that produced them.
The specific pain of network cost is that it does not scale with usage the way compute does. A workload that doubles its CPU usage pays twice as much for compute, which is intuitive. A workload that doubles its request rate might pay three or four times as much for network because the extra traffic crossed availability zones that the original traffic did not, or started hitting a NAT Gateway that the original traffic bypassed. The cost per unit of work can shift sharply with architectural changes that look benign from a service-code perspective.
This guide covers what actually drives Kubernetes network costs, how the billing works for the specific traffic patterns clusters produce, where the invisible charges hide, and the specific optimizations that reliably reduce the bill without breaking availability or latency. The mechanics apply to all three major clouds, though the specific per-GB rates and the NAT Gateway pricing models differ. Where numbers appear in the guide, they are rough industry averages for US regions as of recent cloud pricing.
The common thread across every optimization in this guide is that network cost is downstream of placement decisions — which service runs in which zone, which pod talks to which replica, which traffic crosses which boundary. Teams that would rather have those placement decisions audited continuously against the actual traffic flows, instead of running quarterly spot checks, can layer a Kubernetes Cost Optimization platform that attributes network cost per workload and surfaces the specific flows driving the bill. Either way, the mechanics below explain what to look for.
What Causes High Kubernetes Network Costs?
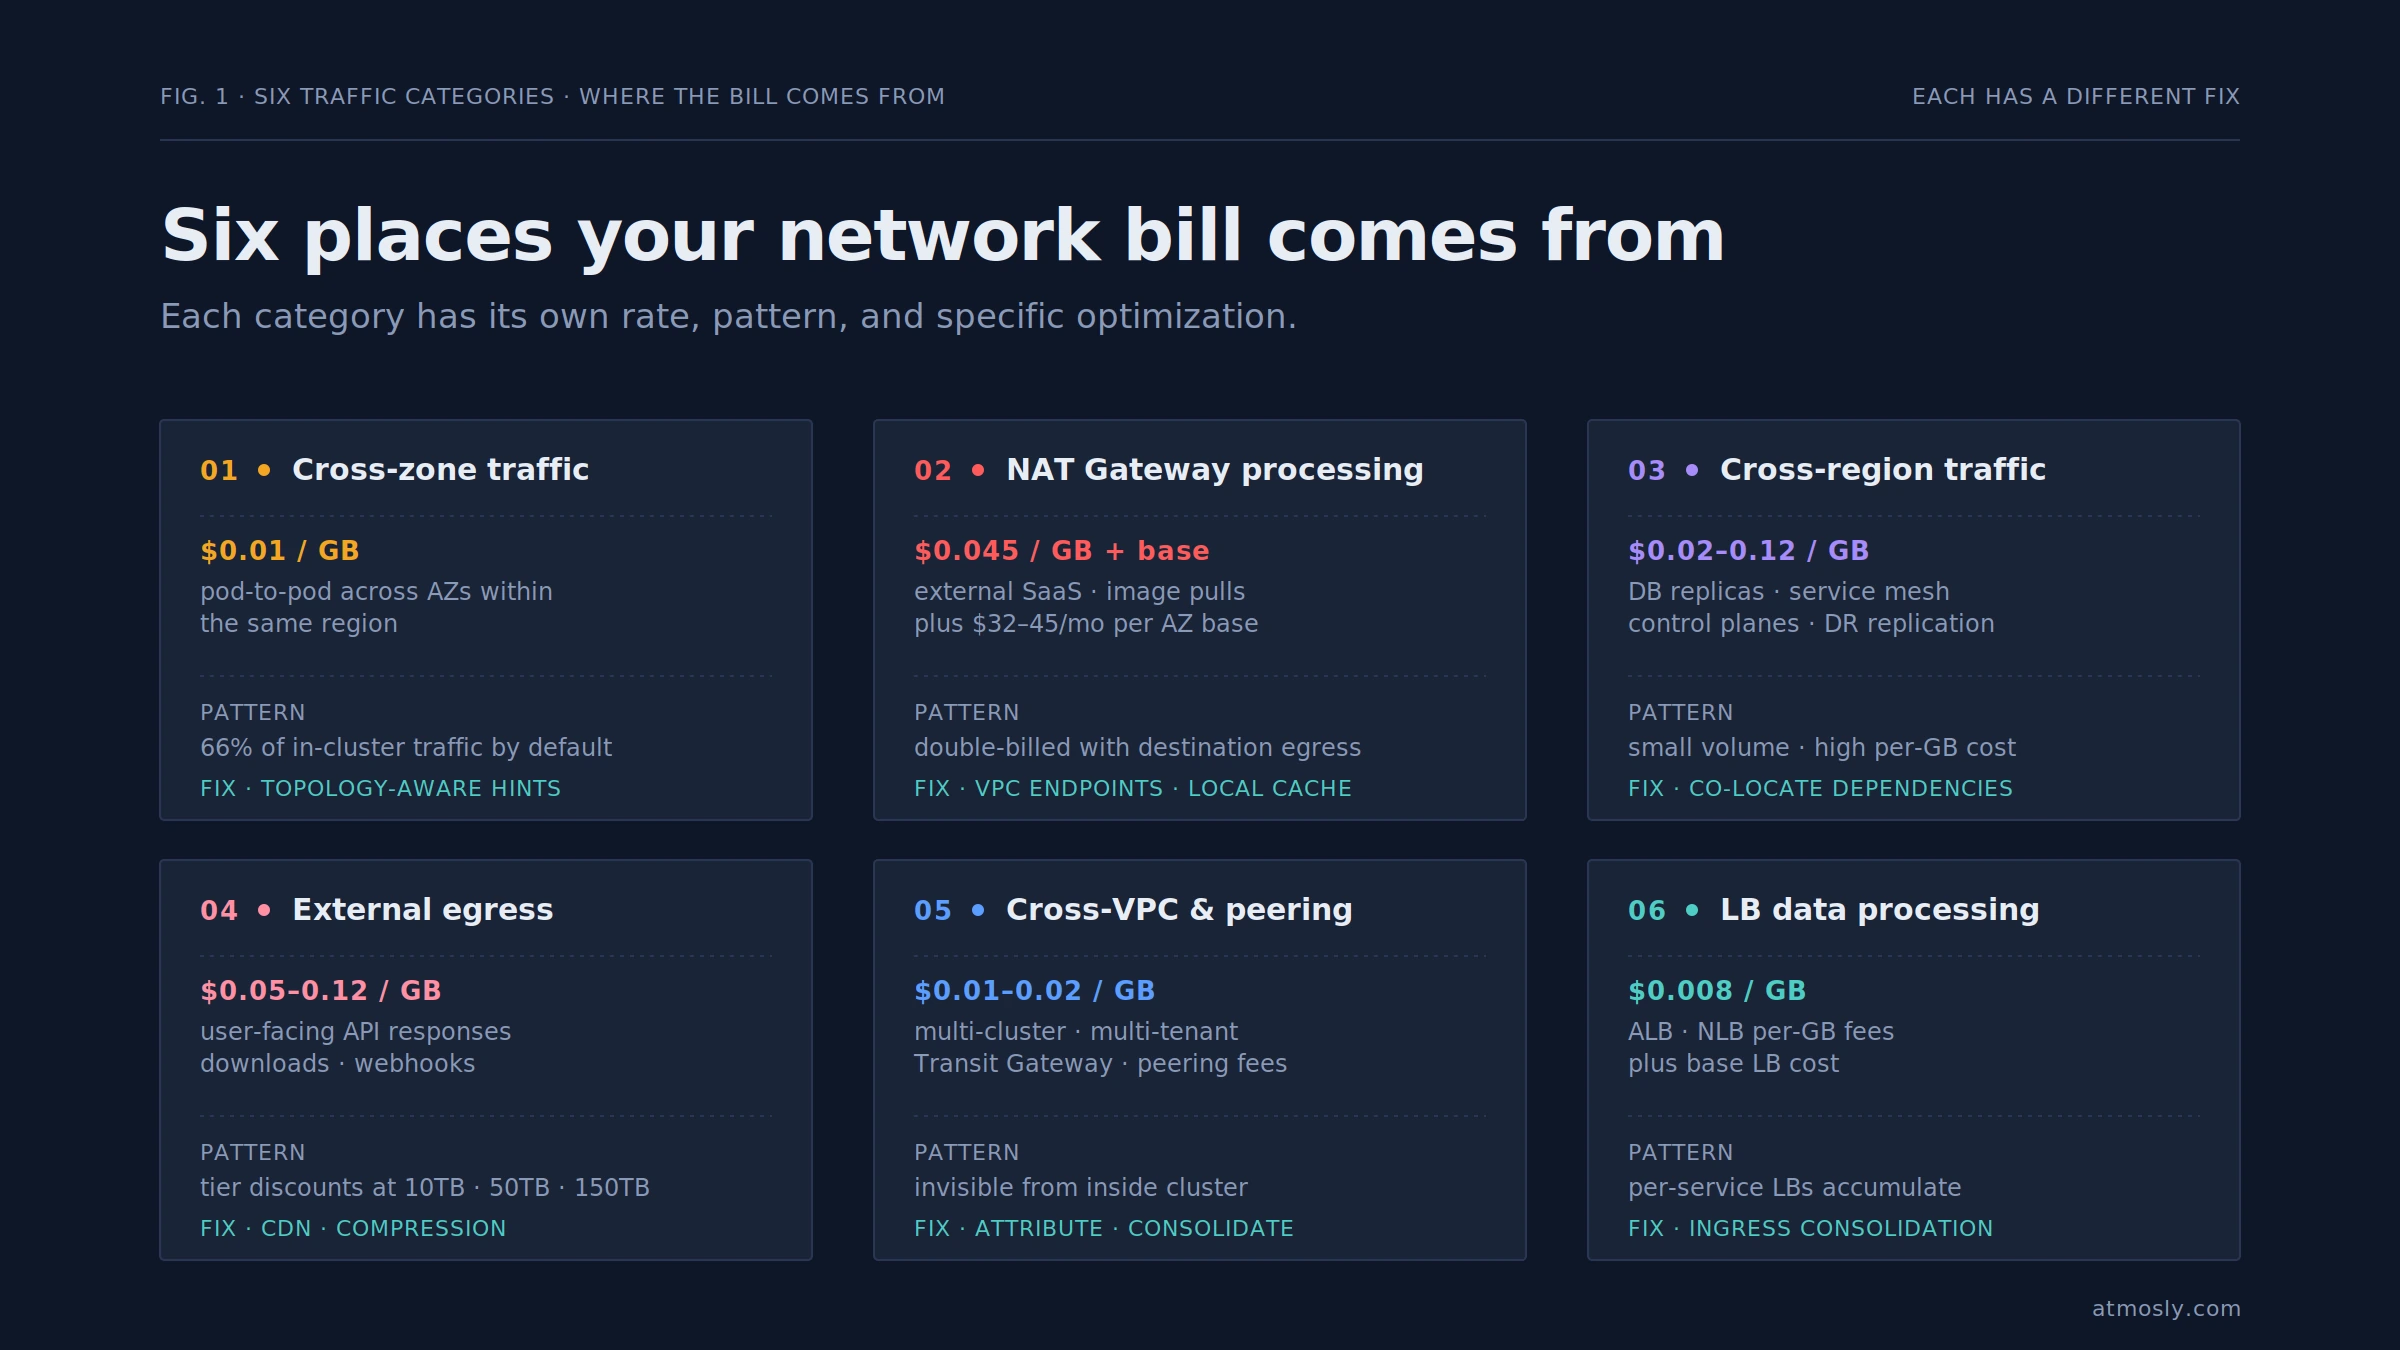
Six specific traffic patterns account for the majority of network charges on a typical Kubernetes bill. Understanding which patterns your workload actually produces is the first optimization — the fixes are different for each, and treating them as one problem produces generic advice that misses the specific cost driver.
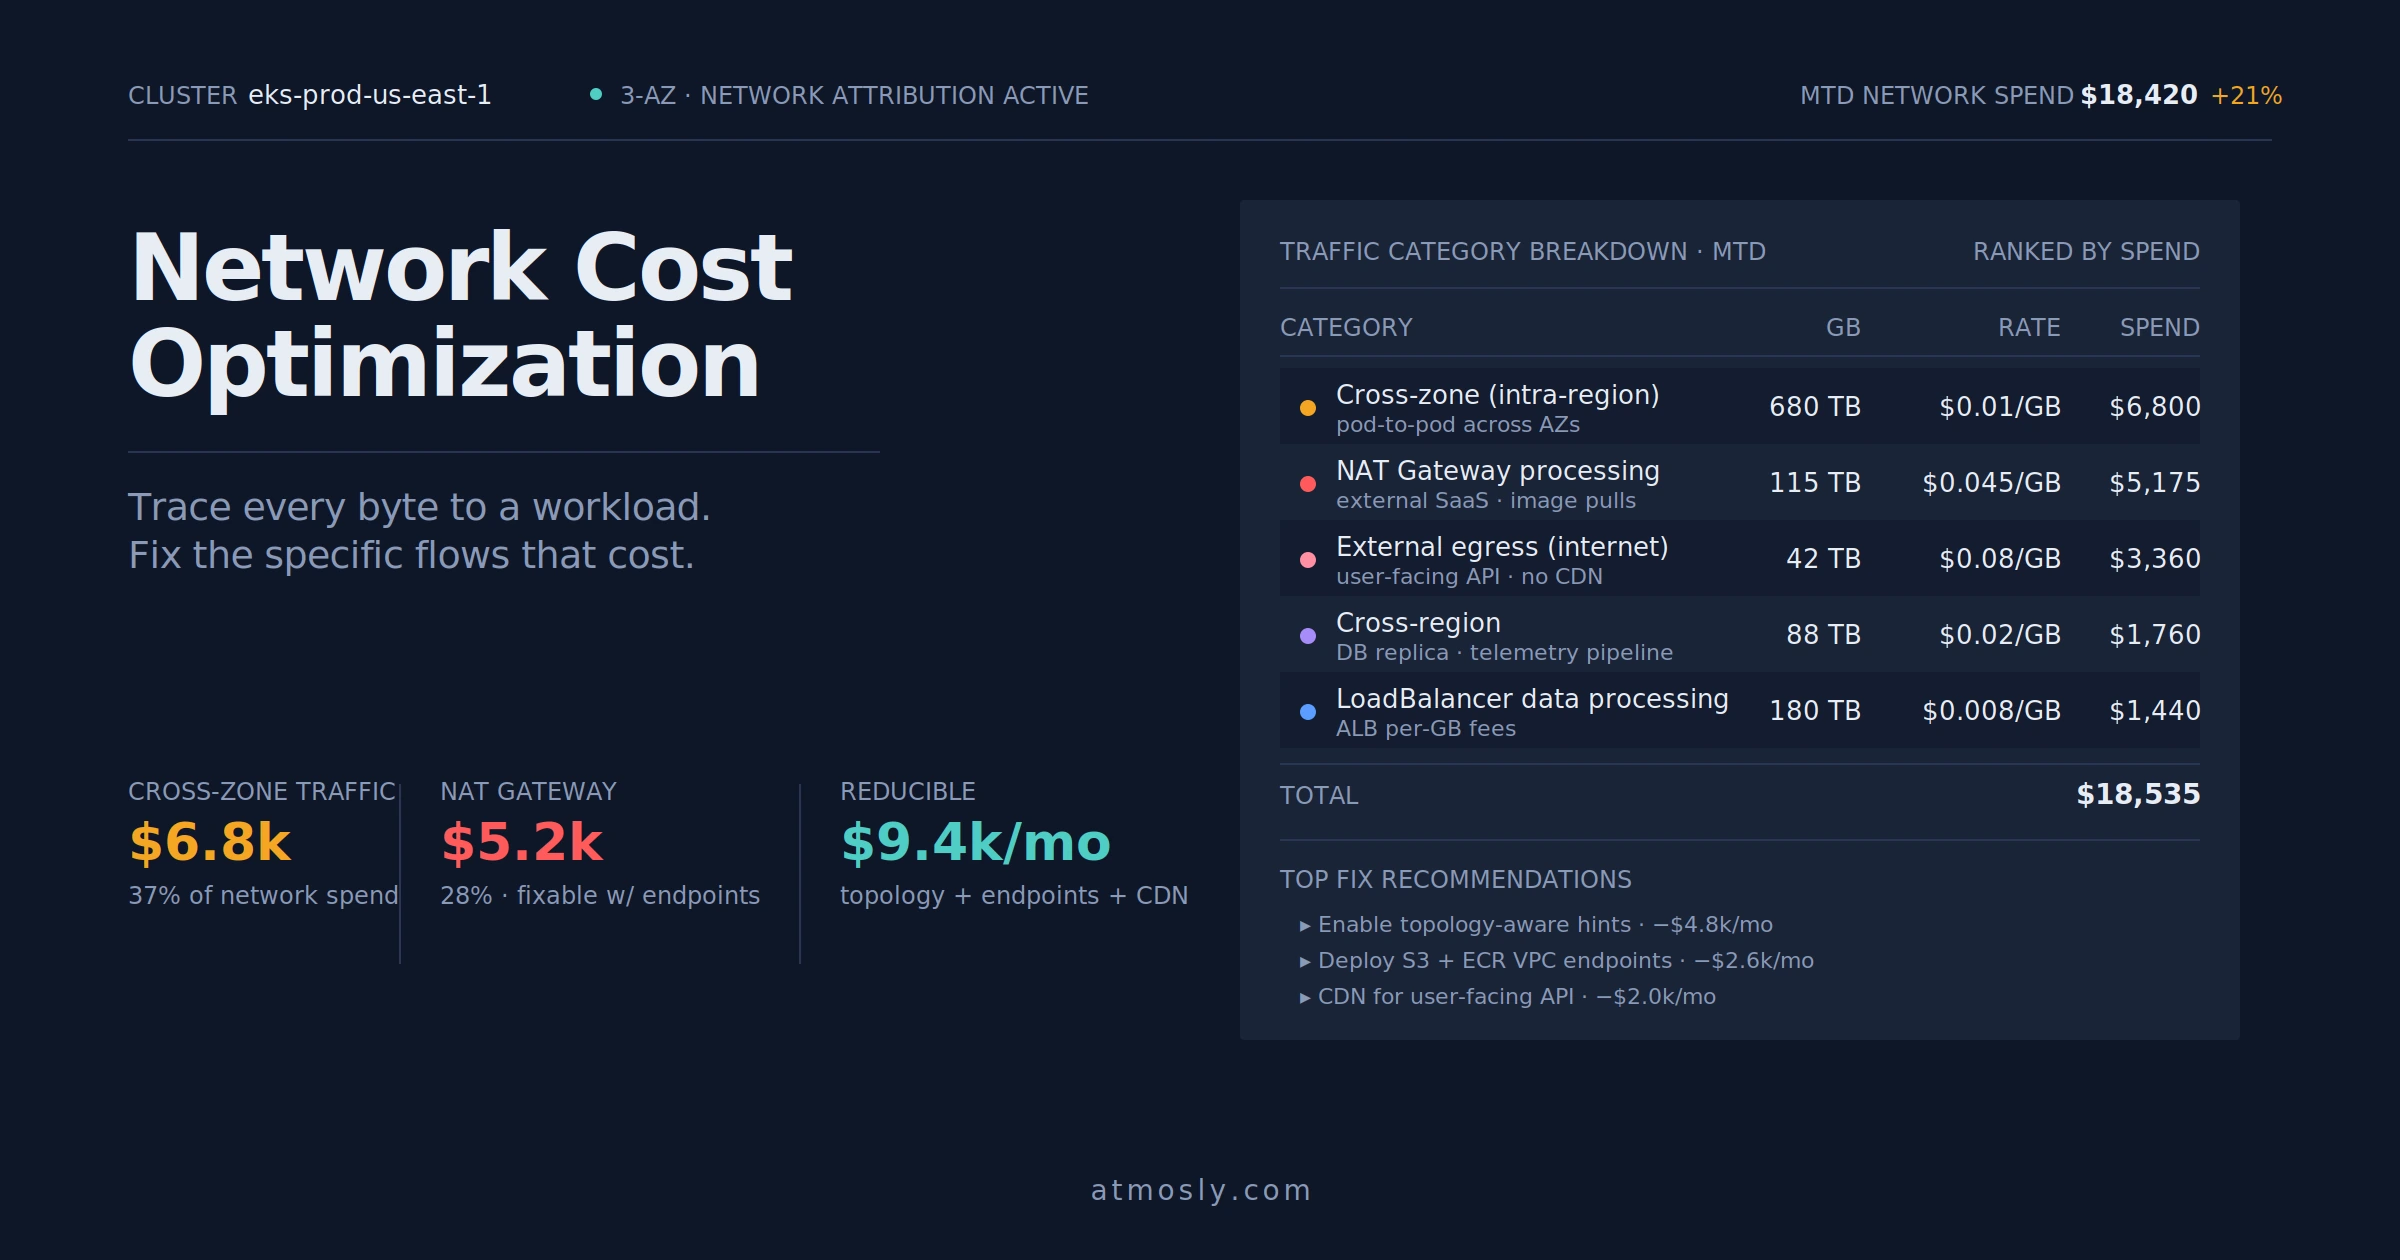
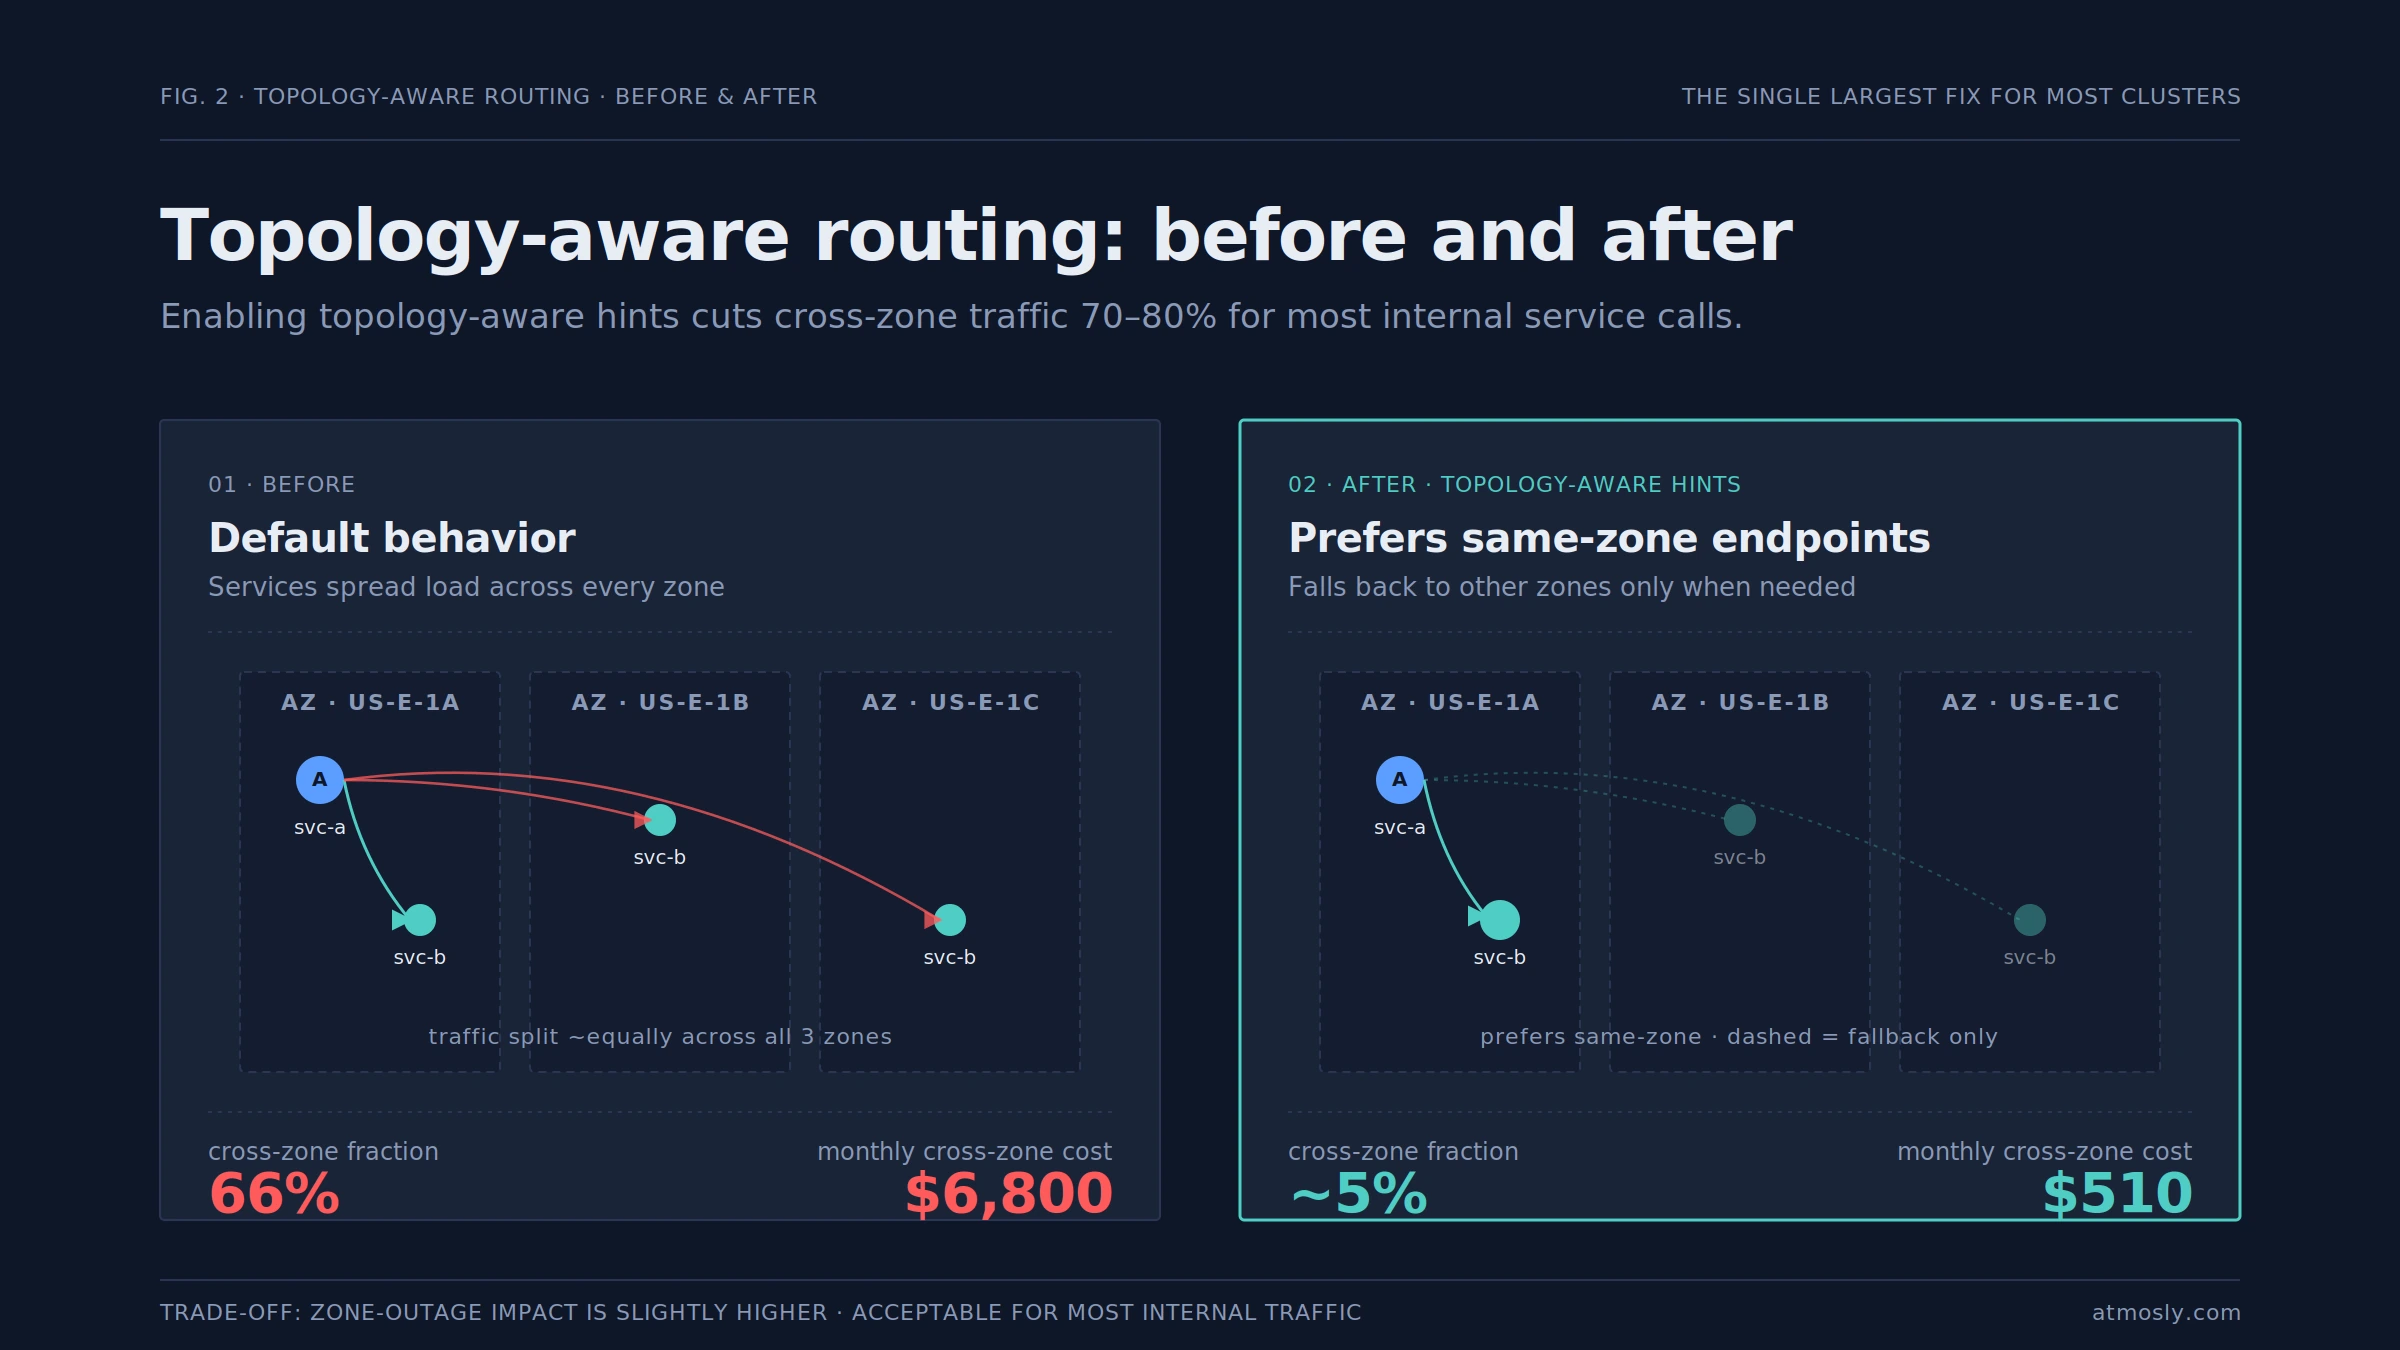
The first is cross-availability-zone traffic within the same region. Clouds charge for traffic between zones to pay for the cross-zone infrastructure, typically $0.01 per GB per direction on AWS and Google Cloud. In a single-zone cluster this is zero; in a three-zone cluster spread across US-East-1a, 1b, and 1c (the default for availability), roughly two-thirds of pod-to-pod traffic ends up crossing zones because services do not know or care which zone their endpoints are in. At single-digit requests per second this is invisible; at hundreds of thousands of requests per second it becomes one of the top line items on the bill.
The second is traffic to the public internet through a NAT Gateway. Pods in private subnets reach external services (SaaS APIs, image registries, package mirrors) through a managed NAT Gateway, which charges both a per-hour base fee (around $32-45/month per AZ) and a per-GB data processing fee ($0.045/GB on AWS) on top of standard egress. Clusters with three AZs run three NAT Gateways, so the base cost before any traffic is $100+/month. High-volume external traffic (ML model downloads, container image pulls not cached locally, log shipping to external SaaS) can produce surprisingly large NAT Gateway bills.
The third is cross-region traffic. Services calling other services in different cloud regions pay $0.02-0.12/GB depending on the specific regions and provider. This almost always comes from one of two patterns: a database replica placed in a different region than its callers for disaster recovery, or a service that was moved to a new region without moving all its dependencies. Cross-region traffic is usually the smallest category by volume but the largest by per-GB rate.
The fourth is external egress to the public internet. User-facing responses, downloads, webhooks to third-party services, and any traffic leaving the cloud boundary pay external egress charges — $0.05-0.12/GB on major clouds, tiered down at higher volumes. For content-heavy workloads (video, large JSON responses, file downloads) this is usually the largest single network cost. CDN placement in front of egress-heavy services is the standard optimization and often cuts this bill by 60-80%.
The fifth is cross-VPC or cross-account traffic. Multi-cluster architectures or multi-tenant setups with separate VPCs per team pay VPC peering or Transit Gateway charges for traffic between them. These are often invisible to the clusters themselves because the traffic looks internal from a Kubernetes perspective, but shows up on the cloud bill as a separate line item that nobody can trace back to a specific workload without proper attribution.
The sixth is load balancer data processing fees. Each LoadBalancer-type Service provisions a cloud load balancer that charges per-GB fees for traffic flowing through it ($0.008/GB on AWS ALB, similar on GCP). High-traffic services with dedicated LBs can accumulate significant data processing charges separate from the base LB fees. Consolidating multiple services under a shared Ingress reduces both the base fees and the per-GB processing cost.
Understanding Kubernetes Data Transfer Charges
The way clouds bill network traffic is more complex than compute, and understanding the model is prerequisite to optimizing against it. Three dimensions determine the rate for any given byte of traffic.
Direction matters. Ingress traffic (data coming into the cloud) is almost always free on major clouds. Egress traffic (data leaving the cloud or crossing boundaries within it) is where the charges accumulate. Internal traffic within the same subnet is typically free; traffic crossing any boundary incurs some charge.
Destination determines the rate. Traffic staying within the same availability zone is usually free. Traffic between zones in the same region is cheapest. Traffic between regions is more expensive. Traffic leaving the cloud to the public internet is most expensive, with per-destination-continent tiering. The specific rates matter less than the ordering — any optimization that moves traffic one tier closer to origin reduces cost.
Volume tiers apply, especially for internet egress. Major clouds offer tiered pricing where the first 10TB, next 40TB, next 100TB, and 150TB+ monthly are billed at progressively lower rates. Workloads at the top tier pay roughly half what workloads at the bottom tier pay per GB. This matters for forecasting — a workload approaching a new volume tier gets cheaper per GB, not more expensive.
NAT Gateway deserves separate treatment because its cost model is different. The base per-hour fee runs regardless of traffic — a NAT Gateway with zero traffic still costs $32-45/month per AZ. On top of that, every GB of traffic through the gateway costs the data processing fee (currently $0.045/GB on AWS) in addition to standard egress charges to the final destination. A gigabyte of traffic going from a pod in a private subnet to an external SaaS API pays NAT data processing plus internet egress — effectively double-billed.
The specific per-GB rates change over time and vary by cloud, so the right discipline is to always check current pricing before making optimization decisions. AWS publishes current rates in the EC2 pricing documentation under Data Transfer — the structure of the bill tends to be stable even as specific numbers drift.
How Cross-Zone and Cross-Region Traffic Increases Costs
Of the six traffic categories, cross-zone and cross-region are the ones that catch the most teams by surprise because the traffic itself was never designed to cross boundaries. The traffic emerged from how Kubernetes schedules pods and how services discover endpoints, not from deliberate architectural decisions.
Why cross-zone traffic happens by default. A standard production cluster spreads nodes across three availability zones for durability. Kubernetes services route requests to any endpoint matching the service selector, with no zone preference. When Service A calls Service B, the request goes to a random Service B replica — which, if Service B has three replicas spread across three zones, is in a different zone two-thirds of the time. This is the correct behavior for availability (if a zone goes down, traffic naturally routes to healthy replicas elsewhere), but it means the baseline fraction of cross-zone traffic is around 66% without any topology awareness.
The traffic multiplication effect. Each pod-to-pod call in a microservices architecture compounds cross-zone traffic. If the request path crosses three services (A → B → C), and each call has a 66% chance of crossing zones, the request is almost certain to cross zones at least once and often multiple times. A single user-facing request that touches ten internal services can incur five or more cross-zone hops, multiplying the per-request network cost by the number of hops.
Where cross-region traffic sneaks in. The common patterns: a database read replica in a different region used for cross-region failover, service meshes with their control plane in a central region sending telemetry across regions from every workload, backup jobs that copy data to a different region for durability, image registries hosted in one region but pulled from clusters in multiple regions. Any of these can be the right architectural choice; what makes them a cost problem is doing them without having priced the traffic volume.
Topology-aware routing. Kubernetes 1.21 introduced topology-aware hints, which signal to kube-proxy and service meshes that endpoints should be preferred in the same zone as the caller when possible. Enabling this at the service level cuts cross-zone traffic dramatically — often 70-80% for internal service-to-service calls. The tradeoff is that if the local-zone replicas become unavailable, traffic has to fall back to other zones; this is the correct behavior for availability but means that during a zone outage, more traffic is affected than in the fully-spread model. For most internal traffic this is an acceptable trade; for critical user-facing paths it needs more careful review.
Service mesh locality routing. For teams running a service mesh (Istio, Linkerd, Cilium), locality-aware load balancing is usually a stronger version of the same control — the mesh maintains an explicit topology map and can route not just by zone but by rack or node when the overhead justifies it. The specific configuration varies by mesh, but the pattern is the same: declare the topology, prefer local endpoints, fall back only when needed.
The specific per-cluster audit of cross-zone traffic patterns, orphaned flows, and placement anomalies is covered in detail in the Kubernetes idle resources playbook — many of the same investigative patterns apply, with network cost replacing compute cost as the target.
Strategies to Reduce Kubernetes Network Data Transfer
Beyond cross-zone routing, several specific optimizations reliably reduce network bills across most Kubernetes environments. Each addresses a different one of the six traffic categories.
VPC endpoints for AWS service calls. Pod traffic to AWS services (S3, DynamoDB, ECR, SQS) by default goes through the NAT Gateway, incurring data processing charges on every byte. Deploying VPC endpoints for these services routes the traffic over the private network instead of through NAT, eliminating the data processing fee. Interface endpoints have a small per-hour cost, so the math works out when the traffic volume exceeds roughly 15-20GB/month per endpoint. For high-traffic services like S3, Gateway endpoints are free and should always be deployed. This single optimization often cuts NAT costs by 40-60%.
Container image caching and registry placement. Image pulls from external registries (Docker Hub, Quay, public ECR) go through NAT Gateway at $0.045/GB on top of the pull itself. Running a local registry mirror or using an in-region ECR with Gateway endpoint cuts both the NAT cost and the pull latency. For clusters with high pod churn (CI runners, autoscaled workloads, dev environments), image pull traffic can be surprisingly large and benefits significantly from local caching.
CDN placement for egress-heavy services. Services sending user-facing content (API responses, downloads, media files) directly from the cluster pay the full external egress rate for every byte. Placing a CDN (CloudFront, Cloud CDN, Fastly) in front shifts the traffic to CDN rates, which are usually dramatically cheaper for the same content, and the first time a file is served it caches close to the user. Content-heavy workloads often see 60-80% reduction in external egress cost after CDN placement.
Response compression. HTTP response compression (gzip, Brotli) reduces the actual bytes transferred, which directly reduces egress charges proportional to the compression ratio. For text-heavy content (JSON API responses, HTML, CSS, JavaScript), compression typically achieves 60-80% reduction. Compression is usually configured at the ingress or application layer and costs minimal CPU; it is one of the simplest optimizations with meaningful impact.
Private Service Connect / PrivateLink for cross-cloud dependencies. Workloads calling third-party services through the public internet pay external egress rates. If the third-party service supports PrivateLink (AWS), Private Service Connect (GCP), or equivalent, routing the traffic over the private backbone eliminates the egress charge entirely. This matters most for high-volume integrations with managed databases, SaaS APIs, and other heavy integration points.
Database and cache co-location with callers. A database read replica in a different zone from its callers produces continuous cross-zone traffic for every query. Co-locating the primary database (or at least a read replica) with the services that query it most heavily can eliminate the cross-zone cost. This is especially impactful for read-heavy workloads where most queries hit the replica rather than the primary.
Service mesh overhead review. Service meshes add their own network traffic — sidecar proxies send telemetry to control planes, mTLS adds handshake overhead, locality-aware routing adds control-plane traffic. For low-volume services, this overhead can exceed the application traffic. Reviewing whether every service needs the full mesh, or whether lighter alternatives (CNI-level mTLS, basic topology hints) would suffice is worth doing at least annually.
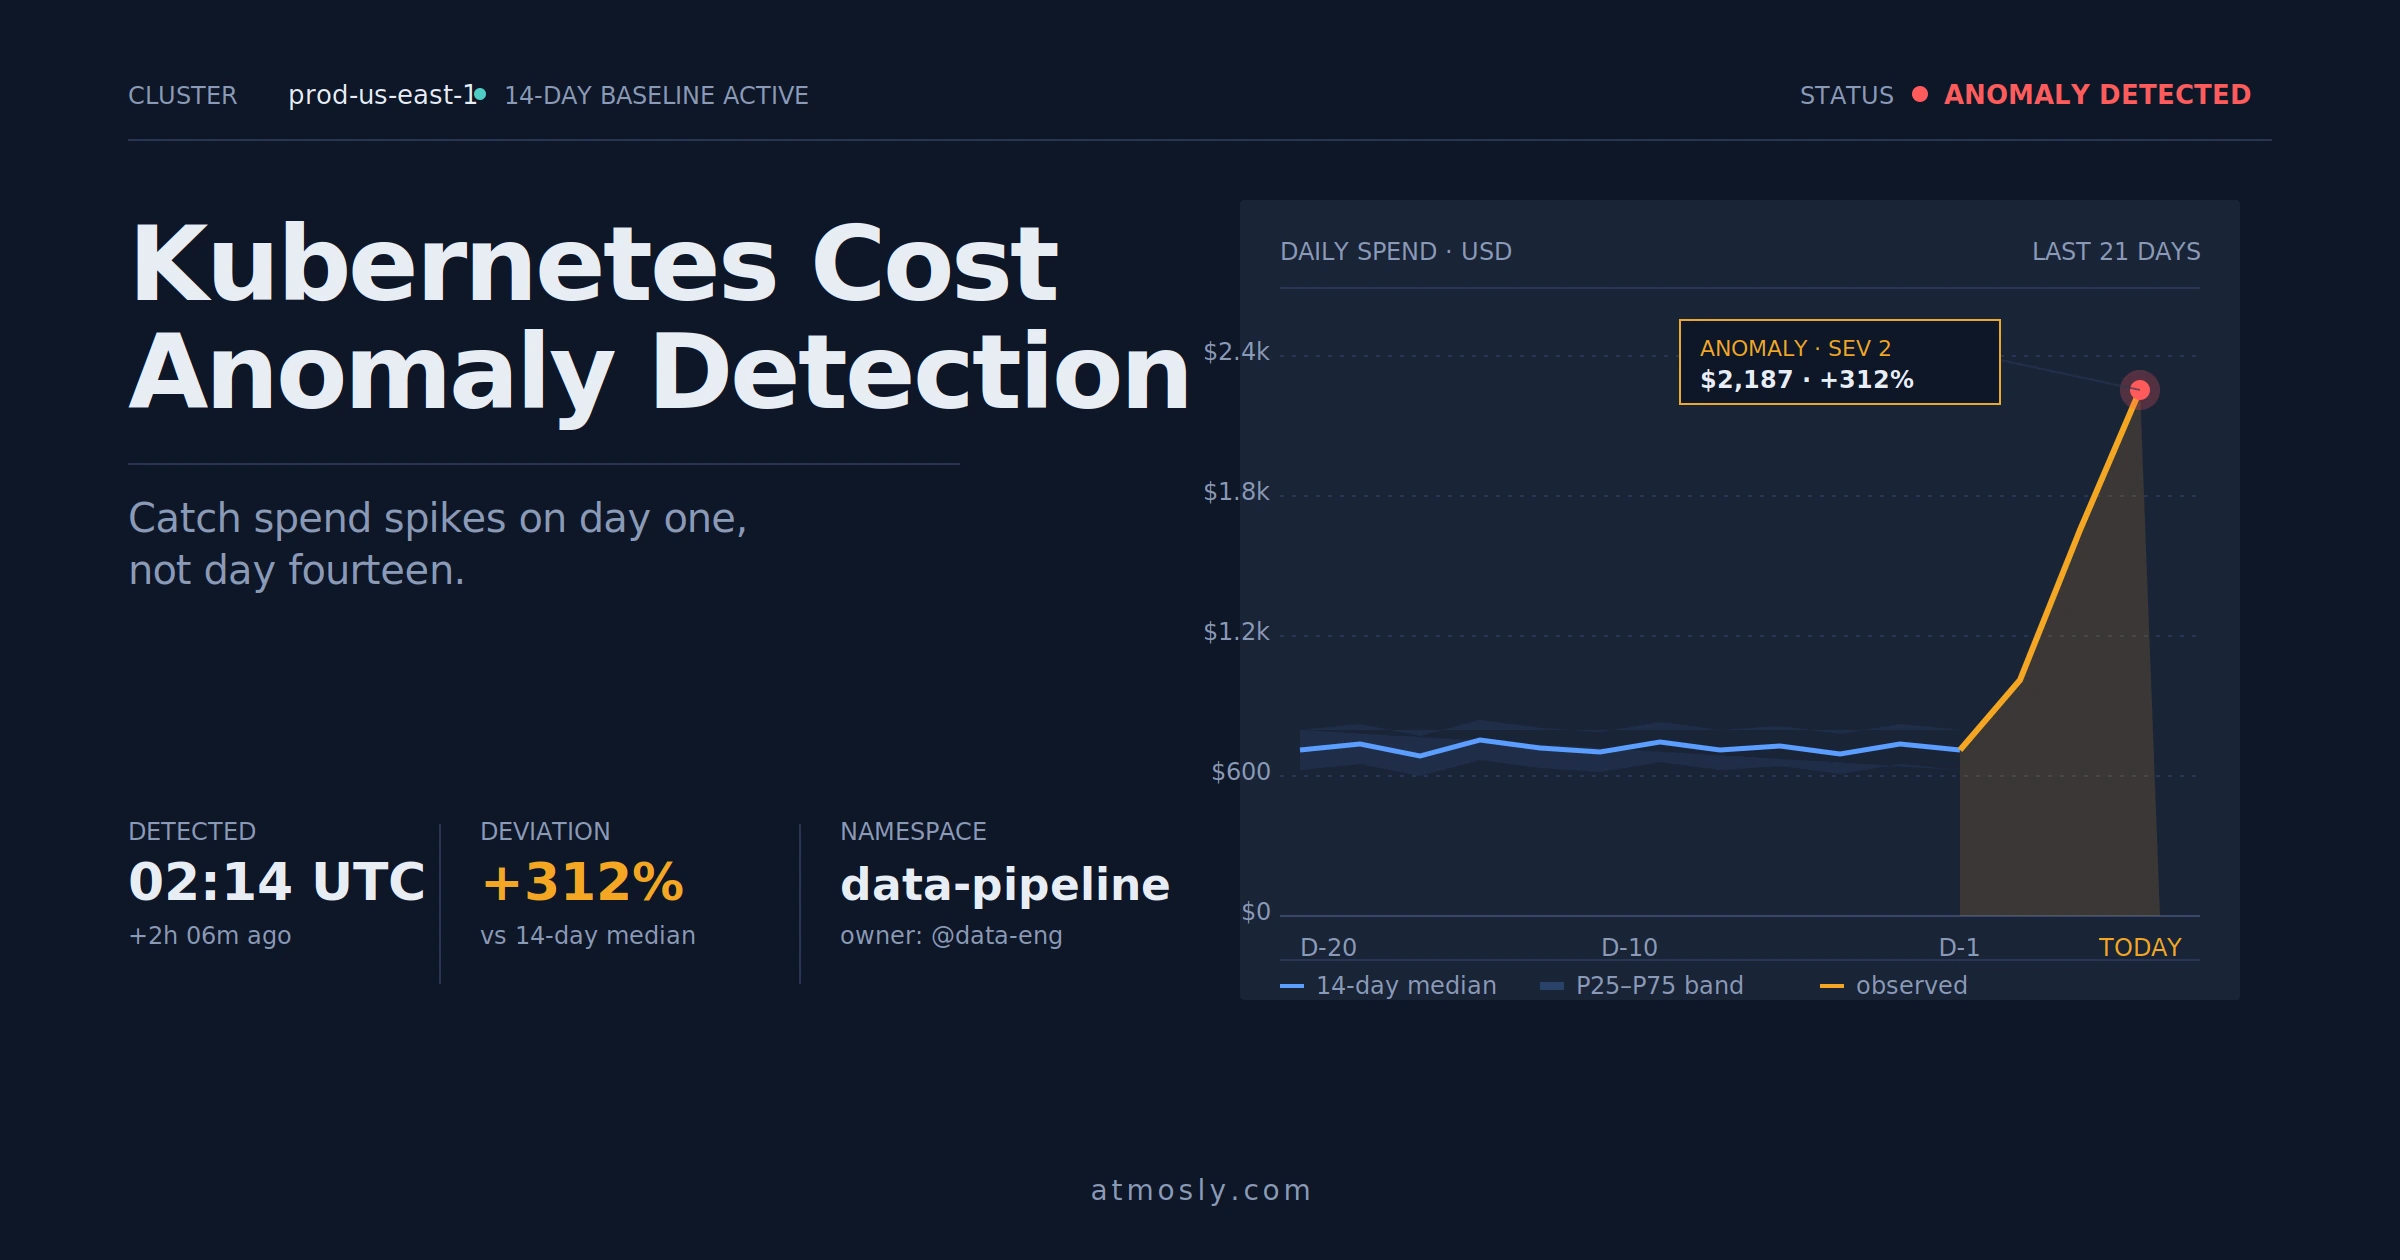
Egress rate limiting for runaway workloads. A single misbehaving workload can produce a disproportionate share of the network bill — a loop sending telemetry to an external SaaS endpoint, a backup job without rate limiting, a debug flag writing full request bodies to an external logging service. Egress-level rate limits on egress-heavy namespaces catch these before they produce five-figure monthly surprises. The specific pattern of catching runaway network costs in real time is the same discipline that catches cost anomalies more broadly — network is just one category of the signal.
Best Practices for Kubernetes Network Cost Optimization
The teams that keep network costs under control over time share a few habits that the teams struggling with them usually do not.
They attribute network cost per workload, not just per cluster. A fleet-level view that shows "the cluster used 40TB of egress this month" is directionally useful but does not point at a specific team or service. Per-workload attribution — joining VPC flow logs or similar to Kubernetes labels — surfaces which services are driving the bill and lets the fix land with the right owner.
They make topology-aware routing the default for internal services. Rather than enabling it per-service as an optimization, they ship clusters with topology-aware hints enabled by default and require an explicit opt-out for services that need pure zone-balance. The failure mode of defaulting to spread-balance is quiet overspending; the failure mode of defaulting to topology-aware is slightly more impact during zone outages. The second trade is usually the right one.
They review NAT Gateway traffic monthly. NAT Gateway is the single most expensive network component for most clusters, and the traffic flowing through it changes as new services deploy. A monthly check of the top destinations through NAT, with questions about why each one is not using a VPC endpoint instead, catches the drift before it becomes a bill.
They budget for network separately from compute. Lumping network into "cloud infrastructure" means it never gets dedicated attention. Teams that break network out as its own line item in their cost model, with a dedicated owner and a specific target, see consistently better outcomes. The owner does not have to be a dedicated engineer — part of a platform engineer's time is enough — but there has to be someone who notices when the number moves.
They test topology changes in staging first. The optimizations in this guide have side effects — topology-aware routing changes failure modes, CDN placement adds cache-staleness concerns, VPC endpoints change network paths. Testing in staging with representative traffic patterns catches the surprises before they ship, and avoids the pattern where a cost optimization produces an availability incident that costs more than the savings.
They retire old traffic patterns, not just old services. A service that was deprecated six months ago may still be sending telemetry, pulling updates, or writing to external logging. The cost of these flows persists even when nobody notices the service itself anymore. Periodic review of top traffic sources catches the forgotten flows that keep paying egress long after they stopped mattering.
See which workloads are driving your network bill.
Connect a cluster read-only and get a per-workload network cost breakdown, cross-zone traffic hotspots, and NAT Gateway attribution within minutes. No cluster changes. Try it free →