The move from one Kubernetes cluster to many happens for good reasons — regional presence, tenant isolation, environment separation, acquisitions inheriting their own infrastructure — and each of those reasons is defensible on its own. What is not defensible is the cost management model that stops working the moment there is more than one cluster to look at. A per-cluster spreadsheet becomes a per-cluster set of spreadsheets that nobody reconciles. A dashboard built for the flagship production cluster does not extend to the twelve smaller ones spread across regions and teams. And the finance team still asks for one number: what did Kubernetes cost this month?
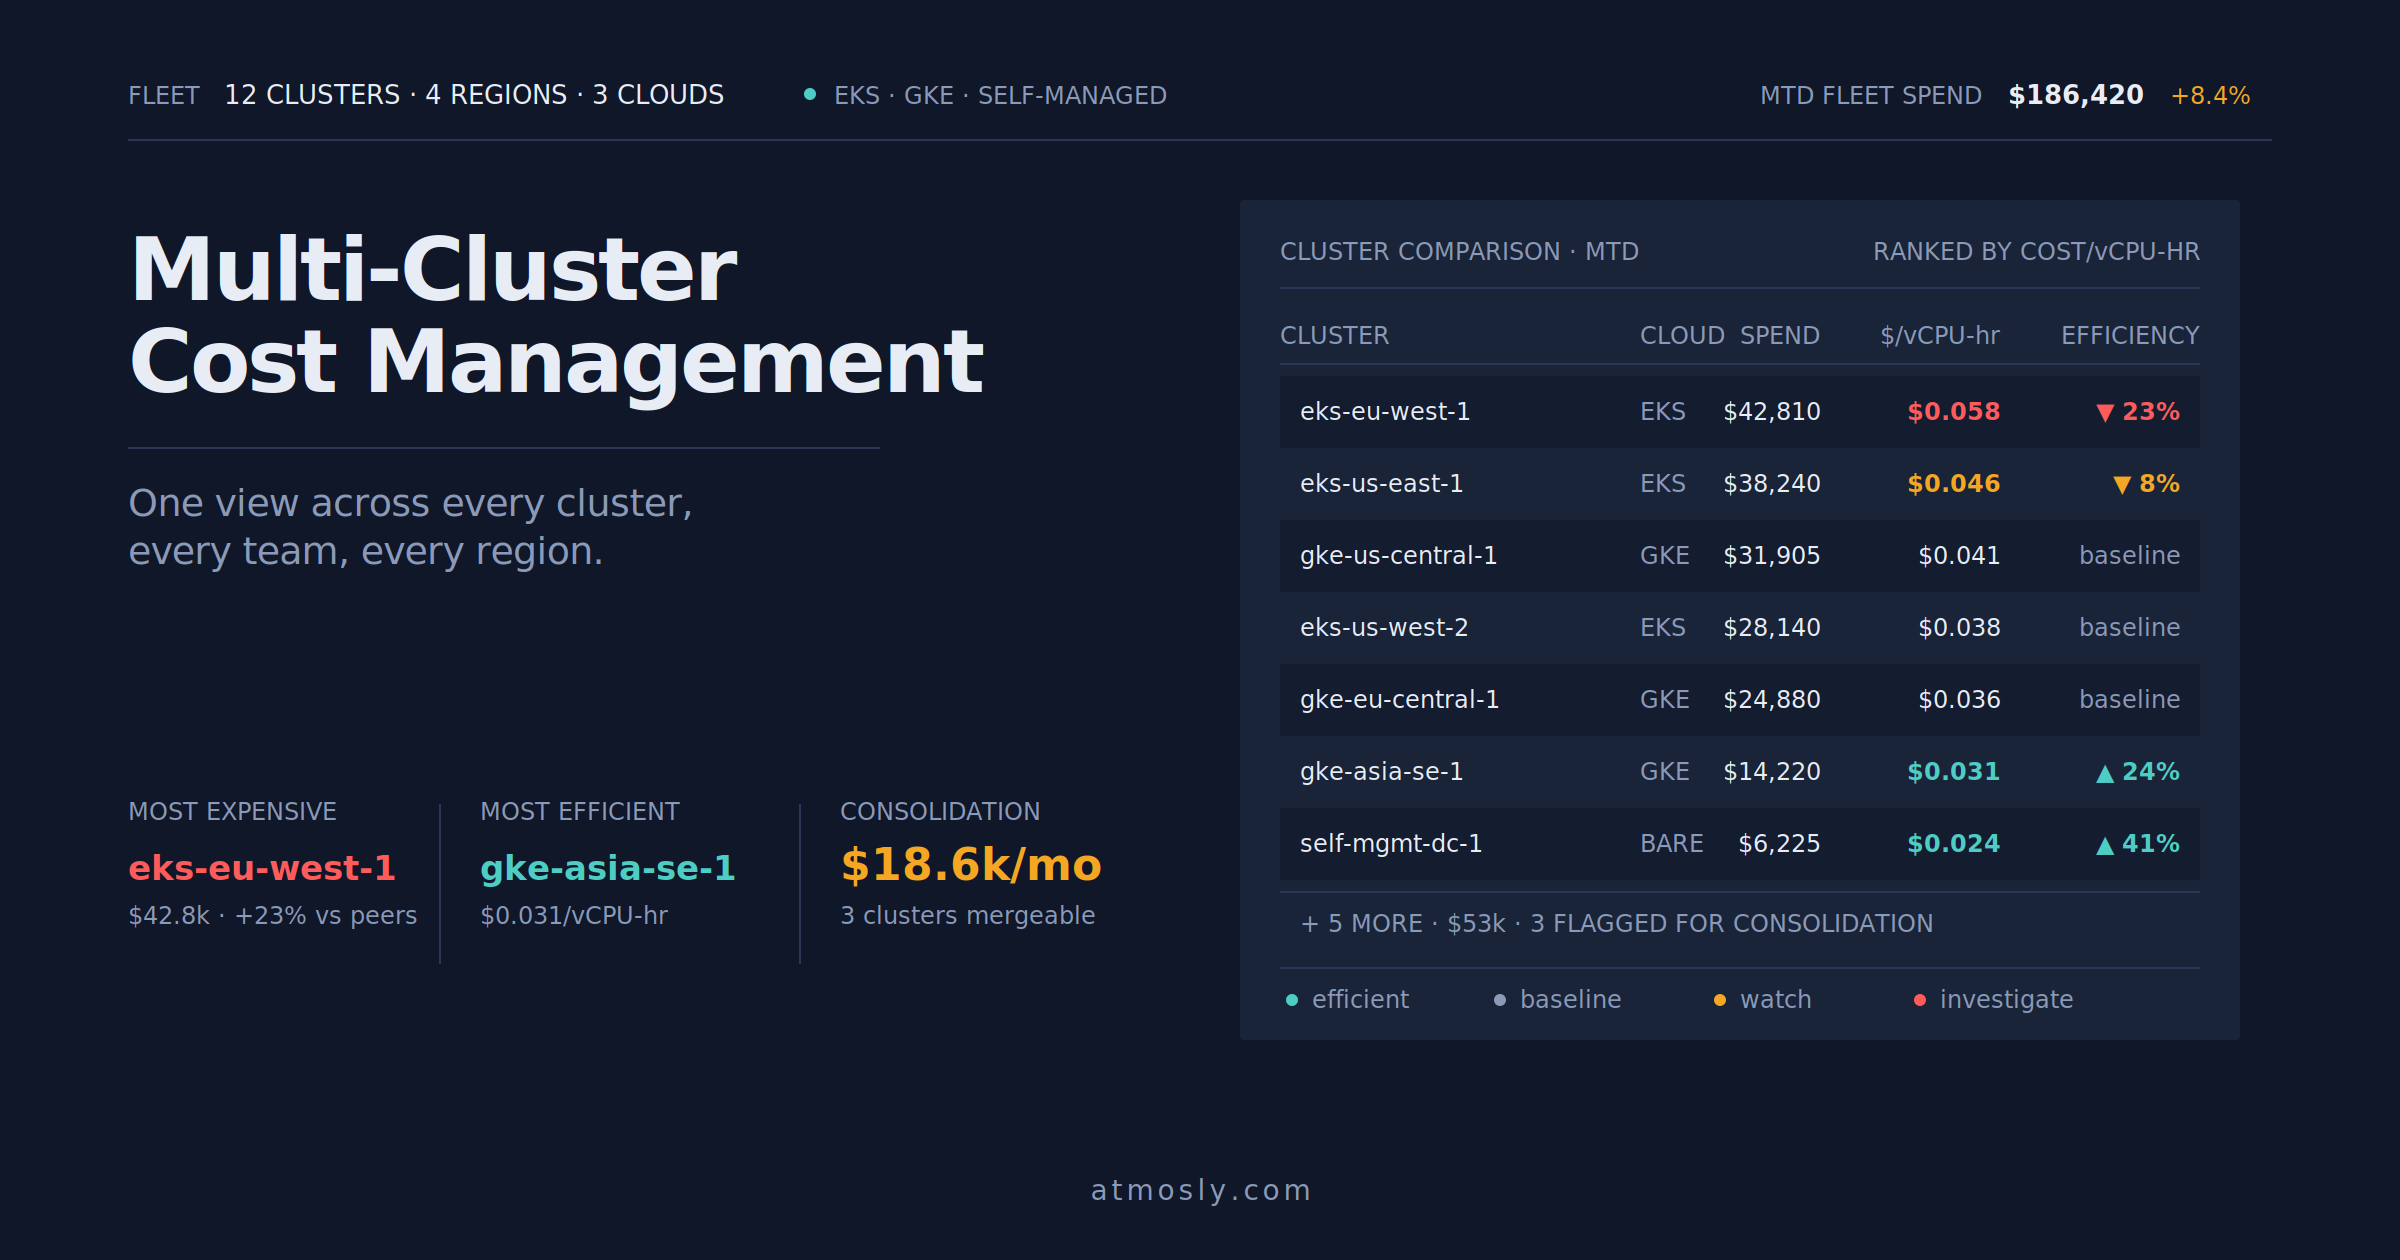
Multi-cluster Kubernetes cost management is the discipline of answering that question — plus its more useful cousins ("which cluster is most efficient per dollar," "why does the EU cluster cost 40% more per namespace than the US one," "which teams are consuming the most across the fleet") — without spending a week per report. The mechanics are different from single-cluster cost management, not because the per-cluster tools are wrong, but because the operating model has to be, or the fleet becomes ungovernable.
This guide covers why running costs across multiple clusters is genuinely harder than running them across one, how to build the visibility that makes fleet-wide decisions possible, how allocation should work when workloads span clusters and clusters span teams, and where the recurring cross-cluster comparison patterns produce actionable optimizations. Most of the mechanics apply whether the clusters are on the same cloud provider, spread across providers, or a mix of managed and self-hosted.
The core problem is that per-cluster cost tools produce answers per cluster, and fleet decisions require answers across clusters. A team running three EKS clusters and two GKE clusters cannot answer "which region has the highest cost per active user" from five separate dashboards; they need a unified view where the same namespace tag means the same thing in all five places. Teams that would rather have this unified view maintained continuously without building the pipeline themselves can layer a Kubernetes Cost Optimization platform across the fleet — the mechanics below explain what that pipeline needs to do regardless of who builds it.
Why Managing Costs Across Multiple Kubernetes Clusters Is Difficult
The specific pain of multi-cluster cost management comes from five overlapping problems that do not exist in a single-cluster setup.
The first is inconsistent labeling. Cost allocation depends on every workload being tagged with team, service, environment, cost-center, or whatever schema the organization decided on. In one cluster this is enforceable through a policy engine and a well-known convention. Across ten clusters — some of which predate the current schema, some of which were set up by acquired teams with their own schema, some of which enforce labels and some of which do not — the tags are inconsistent, the joins fail, and the fleet-level report shows large chunks of spend as "unattributed." Fixing this is not a technical problem; it is a coordination problem that platform teams solve slowly and never completely.
The second is billing model differences across clouds. An EKS cluster is billed differently from a GKE cluster is billed differently from a self-managed cluster on bare metal. EKS has a control plane fee; GKE has a management fee on top of Autopilot or Standard node pricing; self-managed clusters carry hardware amortization and operations time that never appear on a cloud bill. Comparing them as if they were the same is misleading; comparing them as if they were entirely different loses the fleet-level view. Serious multi-cluster cost programs pick a normalization model — usually cost per vCPU-hour or cost per unit of user-facing throughput — and translate every cluster into it for comparison.
The third is shared infrastructure that does not belong to any single cluster. A shared observability stack (Prometheus federation, log aggregation, tracing backend) serves multiple clusters and gets billed as its own line item. A cross-cluster service mesh runs a control plane somewhere that costs money on behalf of every cluster it manages. Container registries, CI/CD systems, and DNS are typically shared. Attributing this shared spend fairly across the clusters that use it is a modeling decision, and different reasonable choices produce different numbers.
The fourth is replication of everything. Every cluster carries the same baseline overhead — control plane, system daemonsets, monitoring agents, ingress controllers, cert-manager, external-dns — regardless of how much application workload runs on it. In a single large cluster this overhead is a small share of total spend. Split across ten small clusters, it is a much larger share, and the fleet total exceeds what one bigger cluster would have cost for the same workload. Whether that overhead is worth paying depends on why the clusters were split, and the cost model needs to make that trade-off visible.
The fifth is cross-cluster traffic. Any service in cluster A that calls a service in cluster B pays cross-region egress if the clusters are in different regions, and inter-VPC or peering costs if they are in different VPCs or accounts even within the same region. This traffic is invisible in a per-cluster view because neither endpoint sees the total; it only shows up in the aggregate cloud bill under network egress. Multi-cluster architectures that grew organically often carry significant hidden egress cost that nobody has traced back to the specific call patterns.
How to Track Costs Across Kubernetes Clusters
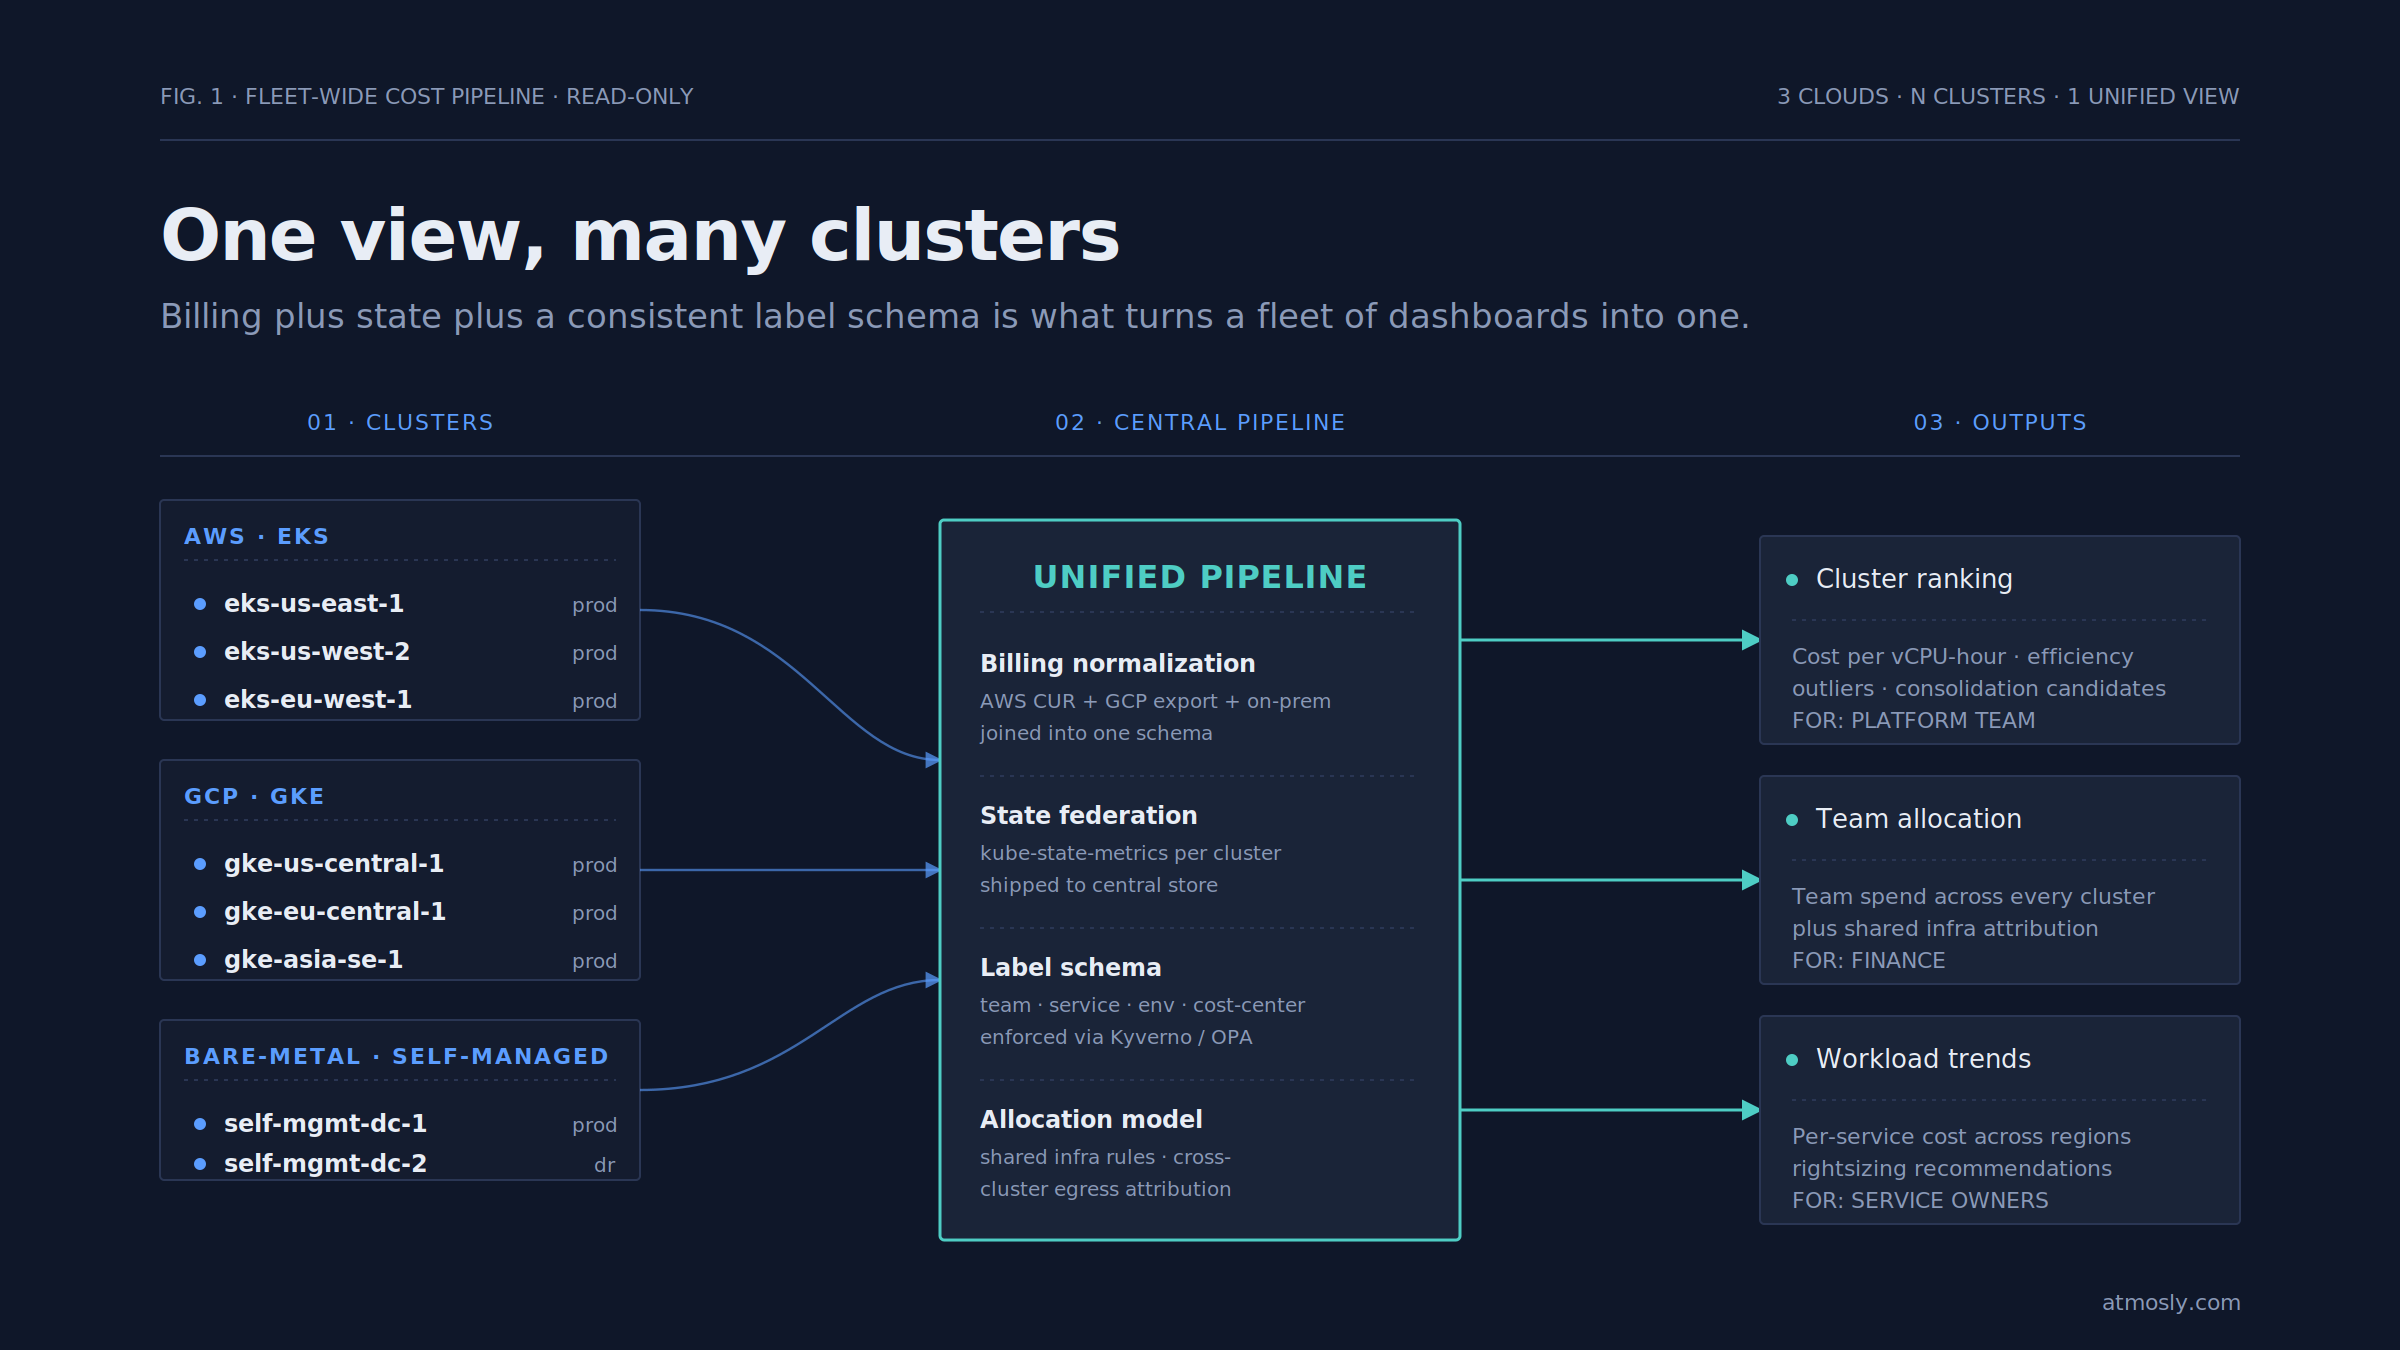
Tracking costs across a fleet requires three layers of data working together: the billing data from each cloud account, the Kubernetes state from each cluster, and a unified schema that maps both into a common model.
The billing layer is straightforward per cluster but painful across clusters. Every cloud provider offers a billing export — AWS Cost and Usage Report, Google Cloud Billing Export, Azure Cost Management — and getting all of them into one data warehouse (BigQuery, Snowflake, Redshift) is the standard pattern. The complication is that the billing schemas differ. AWS bills by resource ARN and usage type; Google bills by SKU and label; Azure bills by resource ID and meter. Normalizing these into a common schema is where the first real investment goes, and skipping it means every fleet-wide report needs a custom join that gets recomputed by hand.
The Kubernetes layer adds per-workload attribution on top of the billing totals. Each cluster needs kube-state-metrics scraped and stored in a location the fleet-level view can query. This is easier than it sounds if you already run Prometheus federation or Thanos for observability, because the same infrastructure that centralizes metrics for alerting also centralizes them for cost attribution. Teams that do not have federated Prometheus usually adopt a purpose-built agent per cluster that ships the state data to a central store.
The unified schema is the piece most teams underinvest in and later regret. A team label that means "payments" in one cluster and "billing" in another (because the team was renamed at some point) will produce two entries in the fleet-wide report, and neither the platform team nor finance will know they should be combined. A consistent naming convention enforced by admission policy — Kyverno or OPA/Gatekeeper across every cluster — is what prevents this. The convention does not have to be complex; it has to be uniform.
The pattern of stitching billing to Kubernetes state per cluster and then combining across clusters is essentially the same allocation problem as showback and chargeback for a single cluster, scaled up. The fleet version has more edge cases (shared infrastructure, cross-cluster traffic, differing billing models) but the core mechanic is the same join.
Allocating Costs by Cluster, Team, and Workload
Once the data is unified, the useful question is not "what did the fleet cost" but "who owes what." Allocation across a multi-cluster fleet has three levels, and each level answers a different question.
Cluster-level allocation answers the platform team's question. Each cluster has a total cost, which decomposes into compute, storage, network egress, management fees, and shared services attributed to that cluster. This view surfaces the clusters that are outliers — one running much hotter than the others, one running much colder, one growing faster than the workload it hosts. These are the candidates for consolidation, migration, or shutdown.
Team-level allocation answers the finance and organizational question. A team that owns services across five clusters has a total spend across those five clusters, and that number is what shows up in their budget. The mechanic is straightforward once the labeling is consistent: sum every workload tagged with the team's label across every cluster, add any shared-service allocation attributed to that team, and present the total. Where it gets interesting is when a workload's cost per unit output varies dramatically between clusters — the same service costing 30% more in one region than another is a signal worth investigating.
Workload-level allocation answers the engineering question. A specific service or namespace has a cost that decomposes into the same categories, and the trend of that cost over time tells the owner whether the service is getting more efficient or less efficient as it scales. This is the level at which rightsizing decisions get made, and rightsizing recommendations need to work at this level across the fleet, not per cluster in isolation — a service that appears in three clusters should get one consistent recommendation, not three that might contradict each other.
Shared infrastructure allocation is the modeling decision that sits underneath these three. A shared Prometheus stack that costs $8k/month serves ten clusters. Allocating it equally means each cluster carries $800; allocating it by usage means the noisier clusters carry more; allocating it by workload count means clusters with lots of small workloads carry more. There is no single right answer — the right answer is the one the platform team and finance agree on and document, so that the allocation is defensible when someone asks.
The right level of granularity depends on what decision the number supports. Cluster-level for consolidation decisions, team-level for budget conversations, workload-level for engineering optimization. A single report at all three levels, with the ability to drill from fleet totals down to specific workloads, is what turns cost data into something teams actually use.
Identifying Cost Differences Between Clusters
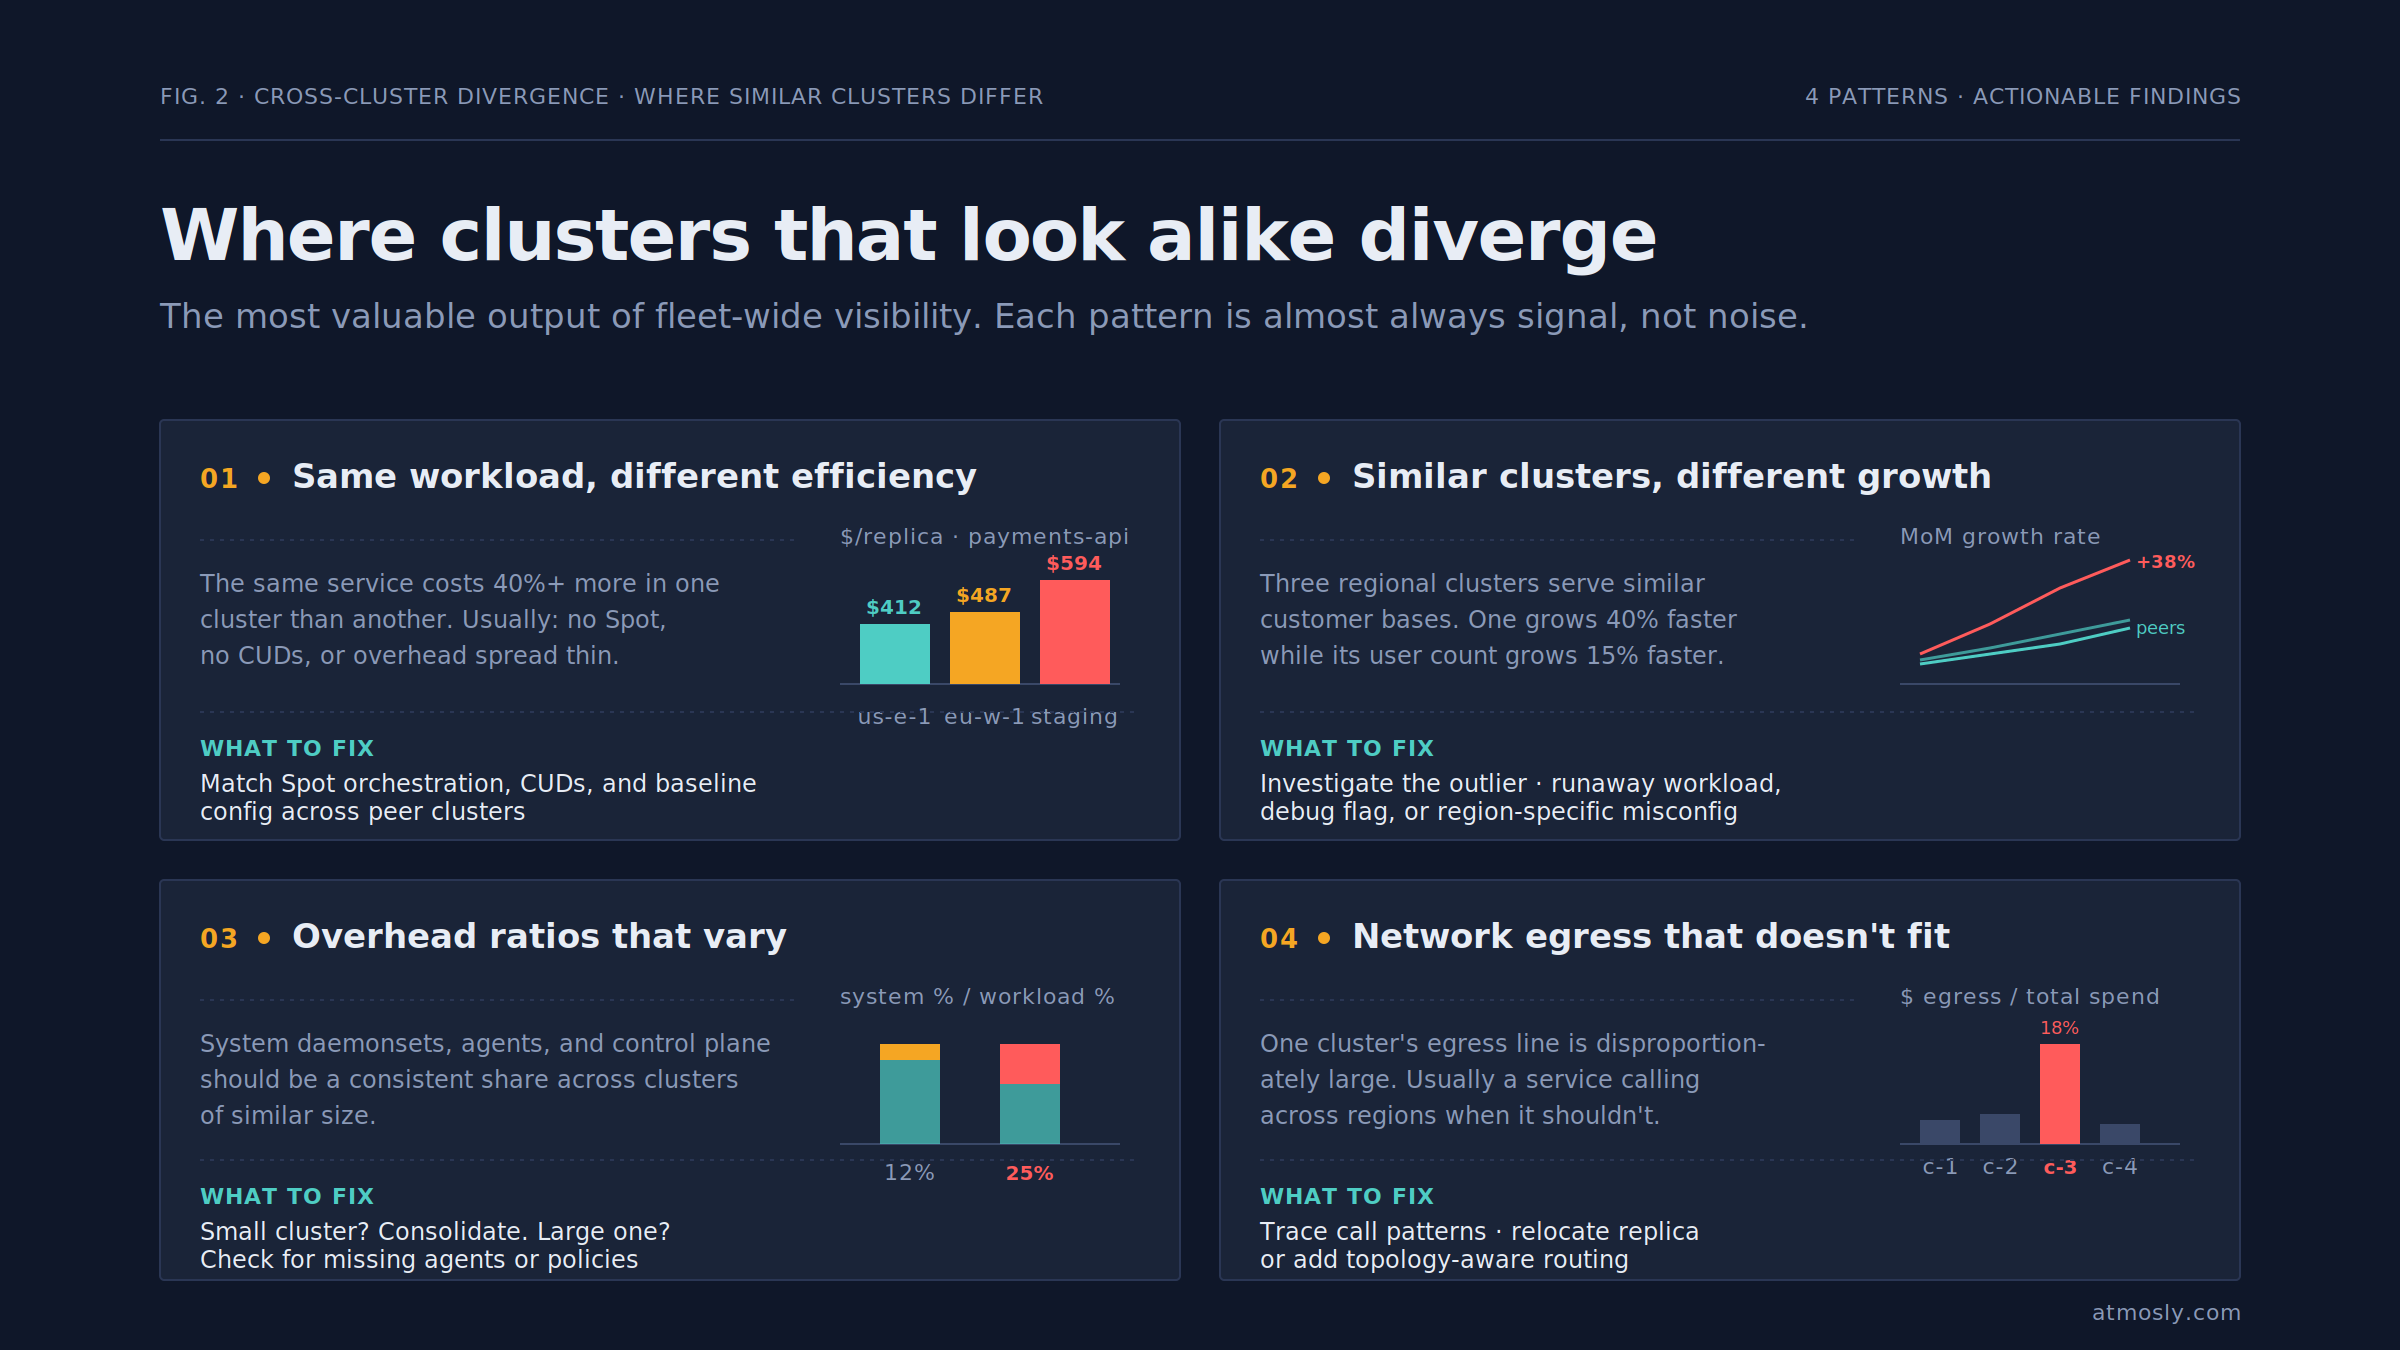
The single most valuable output of fleet-wide cost visibility is spotting where clusters that should look similar actually cost differently. These differences are almost always signal, not noise.
The most common pattern is the same workload running at different efficiencies in different clusters. A service deployed to production and staging usually has similar traffic per replica in the two environments, but the cost per replica can differ by 40% or more. Reasons vary: staging runs on more expensive on-demand nodes because Spot orchestration was never set up there; production has committed use discounts and staging doesn't; the staging cluster has fewer workloads sharing the baseline overhead and so each replica carries more of it. Any of these are worth surfacing and fixing.
The second is similar clusters growing at different rates. Three regional clusters serving similar customer bases should grow roughly in proportion to those customer bases. When one is growing 40% faster while its user count grows 15% faster, something is inefficient — usually a runaway workload, a debug flag, or a scaling misconfiguration specific to that region. This is the pattern that anomaly detection should catch at the cluster level, but the fleet-wide view is where it becomes visible over the longer timescale.
The third is overhead ratios that vary across the fleet. The share of each cluster's spend that goes to system daemonsets, monitoring agents, and control plane costs should be relatively consistent across clusters of similar size. When one cluster's overhead is 25% and its peer's is 12%, either the smaller cluster is inefficiently split (too small to amortize the baseline) or the larger one is missing something (an agent not deployed, a policy not enforced). Both cases are worth investigating.
The fourth is network egress patterns that don't match the architecture. A microservices workload that is designed to keep traffic local should not have significant cross-region egress. When the network line item on one cluster is disproportionately large, it usually means a service is calling across regions when it shouldn't, or a database read replica is placed in the wrong region for its callers. This is the kind of finding that only shows up when you can compare the network cost per unit of workload across clusters that should have similar patterns.
Catching these patterns early — while the divergence is small and the fix is straightforward — is where fleet-wide monitoring earns its keep. The same rolling-baseline approach used for real-time cost anomaly detection within a single cluster applies here at the fleet level: compare each cluster's trajectory against its own baseline and against its peers, and flag deviations before they become billing surprises.
Best Practices for Multi-Cluster Cost Management
The teams that manage multi-cluster fleets without the cost model collapsing share a few habits that the teams struggling with it usually do not.
They standardize the label schema before adding more clusters. Every workload carries the same required labels — team, service, environment, cost-center — enforced through Kyverno or OPA/Gatekeeper policies in every cluster. New clusters inherit the policies as part of their bootstrap. Retrofitting labels onto an established fleet is much harder than requiring them from day one, and every month of delay makes the retrofit more expensive.
They consolidate opportunistically rather than proliferate defensively. A separate cluster is warranted for hard isolation requirements — regulated data, hostile tenants, geographic residency — but is often provisioned for reasons that a namespace and NetworkPolicy would handle just as well. Every unnecessary cluster carries duplicated overhead, and the aggregate of "small enough not to matter" clusters can add 15-25% to fleet spend. Reviewing the cluster inventory annually and asking which ones could be merged is a discipline that pays back over time.
They allocate shared infrastructure explicitly, not implicitly. Shared observability, service mesh control planes, container registries, and CI/CD systems get named cost owners and named allocation methods. "This cost is shared" is not an allocation; it is an evasion. The right method varies by shared service, but every one needs a method that is written down and reviewed periodically.
They compare clusters continuously, not quarterly. Cost dashboards that show fleet totals hide the interesting variance between clusters. Dashboards that put similar clusters side by side — production regions against each other, staging against dev, one team's cluster against another — surface the outliers that quarterly reviews miss. Continuous side-by-side comparison is where most fleet-level optimizations start.
They treat the fleet cost model as software, not documentation. The allocation logic, the label schema, the shared-service attribution rules — these are code, versioned, reviewed, and updated as the fleet changes. When a team is renamed, a shared service is added, or a cluster is decommissioned, the model gets updated in the same commit as the change. Fleet cost models maintained as Confluence pages drift out of date within a quarter.
They feed fleet-level data back into cluster-level decisions. The clusters that consistently rank as most efficient per unit of workload become the template for new clusters. The workload patterns that show up as most expensive per team become the priority for optimization work. The service placements that produce disproportionate cross-cluster egress become candidates for co-location. A fleet cost model that only produces reports is doing half the job; one that changes decisions is doing all of it.
The FinOps Foundation's guidance on multi-cloud and multi-cluster cost management covers the organizational patterns that support this technical work — the roles, the review cadences, and the escalation paths that make fleet cost governance a repeatable discipline rather than a heroic quarterly effort.
See your whole fleet in one view.
Connect every cluster read-only and get a unified cost breakdown by team, workload, and cluster, plus side-by-side comparisons that surface where similar clusters diverge. Setup takes a few minutes per cluster; no changes to anything running. Try it free →