What Kubernetes Audit Logging Is — and What It Isn't
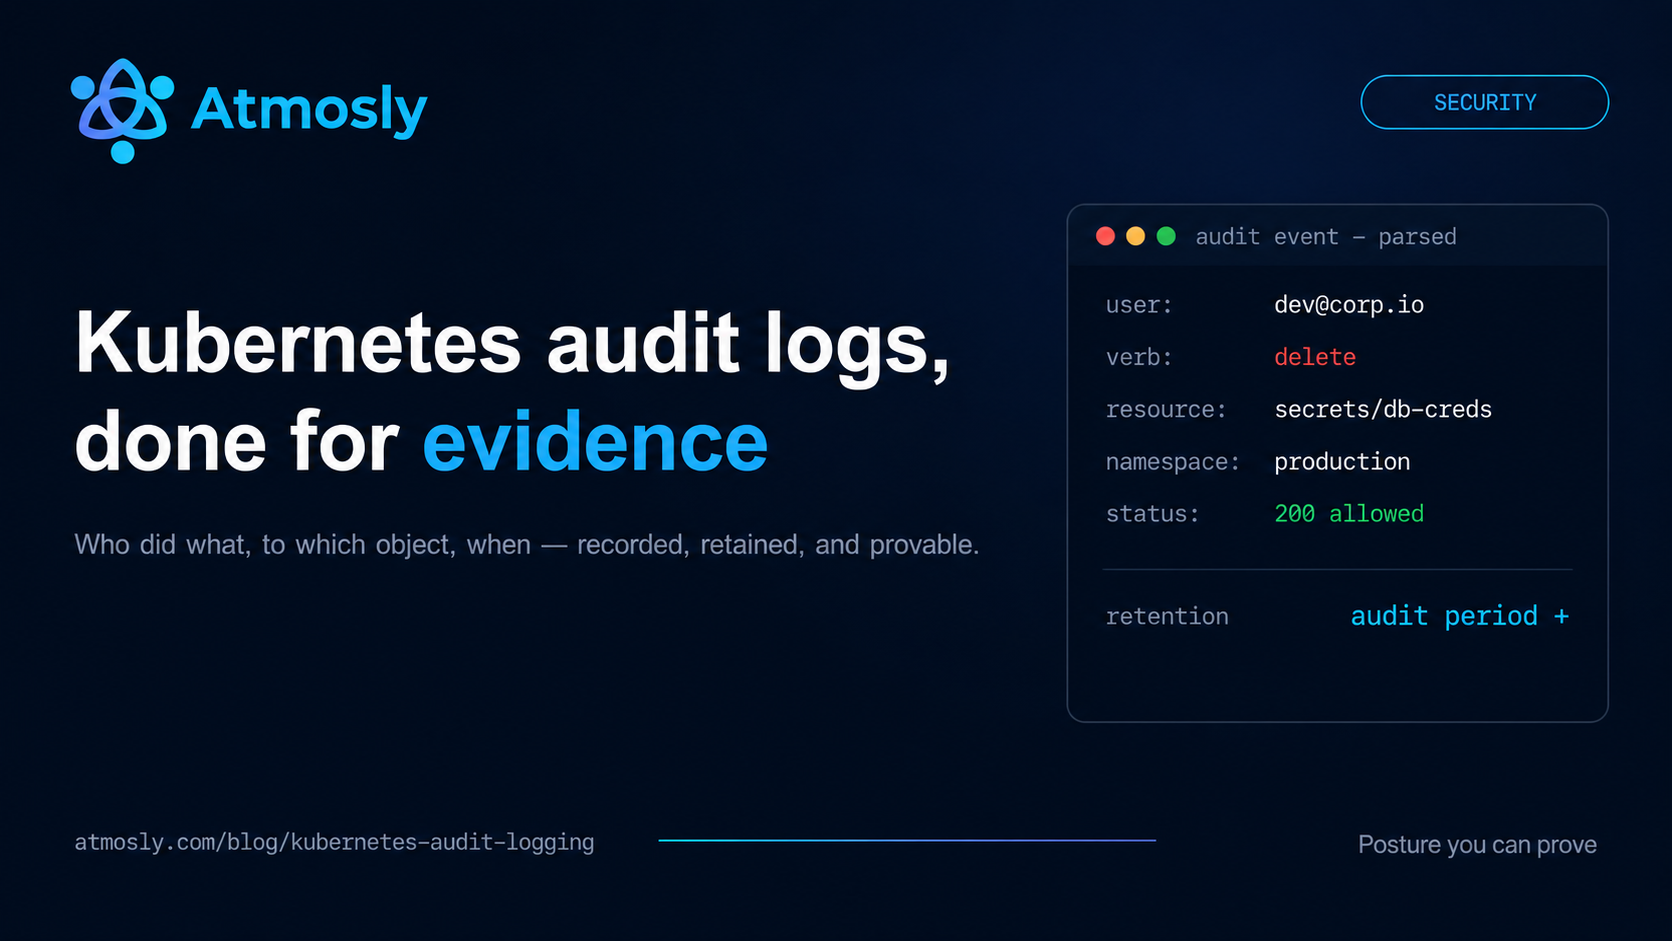
Kubernetes audit logging is the API server's chronological record of every request made to the control plane: who made it (user or ServiceAccount), what they asked for (verb, resource, namespace), when, and whether it was allowed. Because every meaningful action in Kubernetes — deploying a workload, reading a secret, changing an RBAC binding, exec-ing into a pod — passes through the API server, the audit log is the single authoritative answer to the question every incident review and every compliance audit eventually asks: who did what, to which object, when?
It is worth being precise about what this is not, because the two get conflated constantly: audit logs are not application logs. Your EFK or Loki stack collects what your workloads print — errors, request traces, business events — and answers "why is the service failing?" The audit log is emitted by the API server itself and answers "who touched the cluster?" Shipping application logs to a SIEM, however thoroughly, does not substitute for enabling audit logging, and no compliance framework accepts it as such. (For the application side, see our Kubernetes logging guide: EFK vs Loki.)
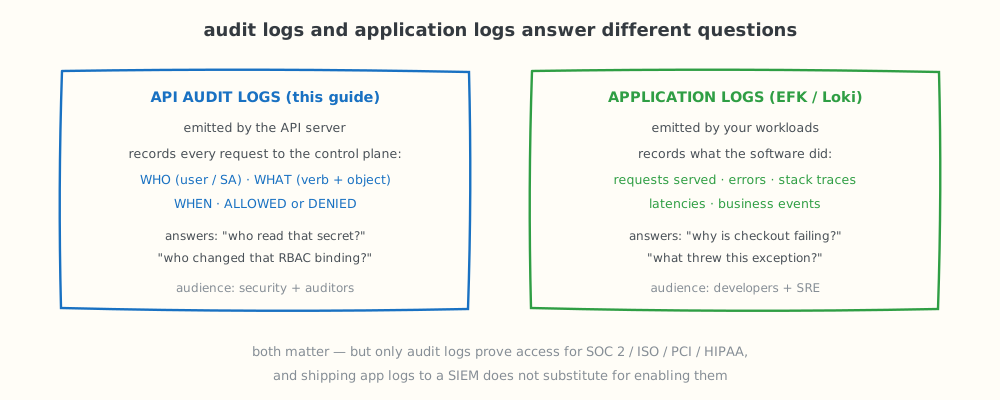
Two log streams, two questions — only the left one is compliance evidence.
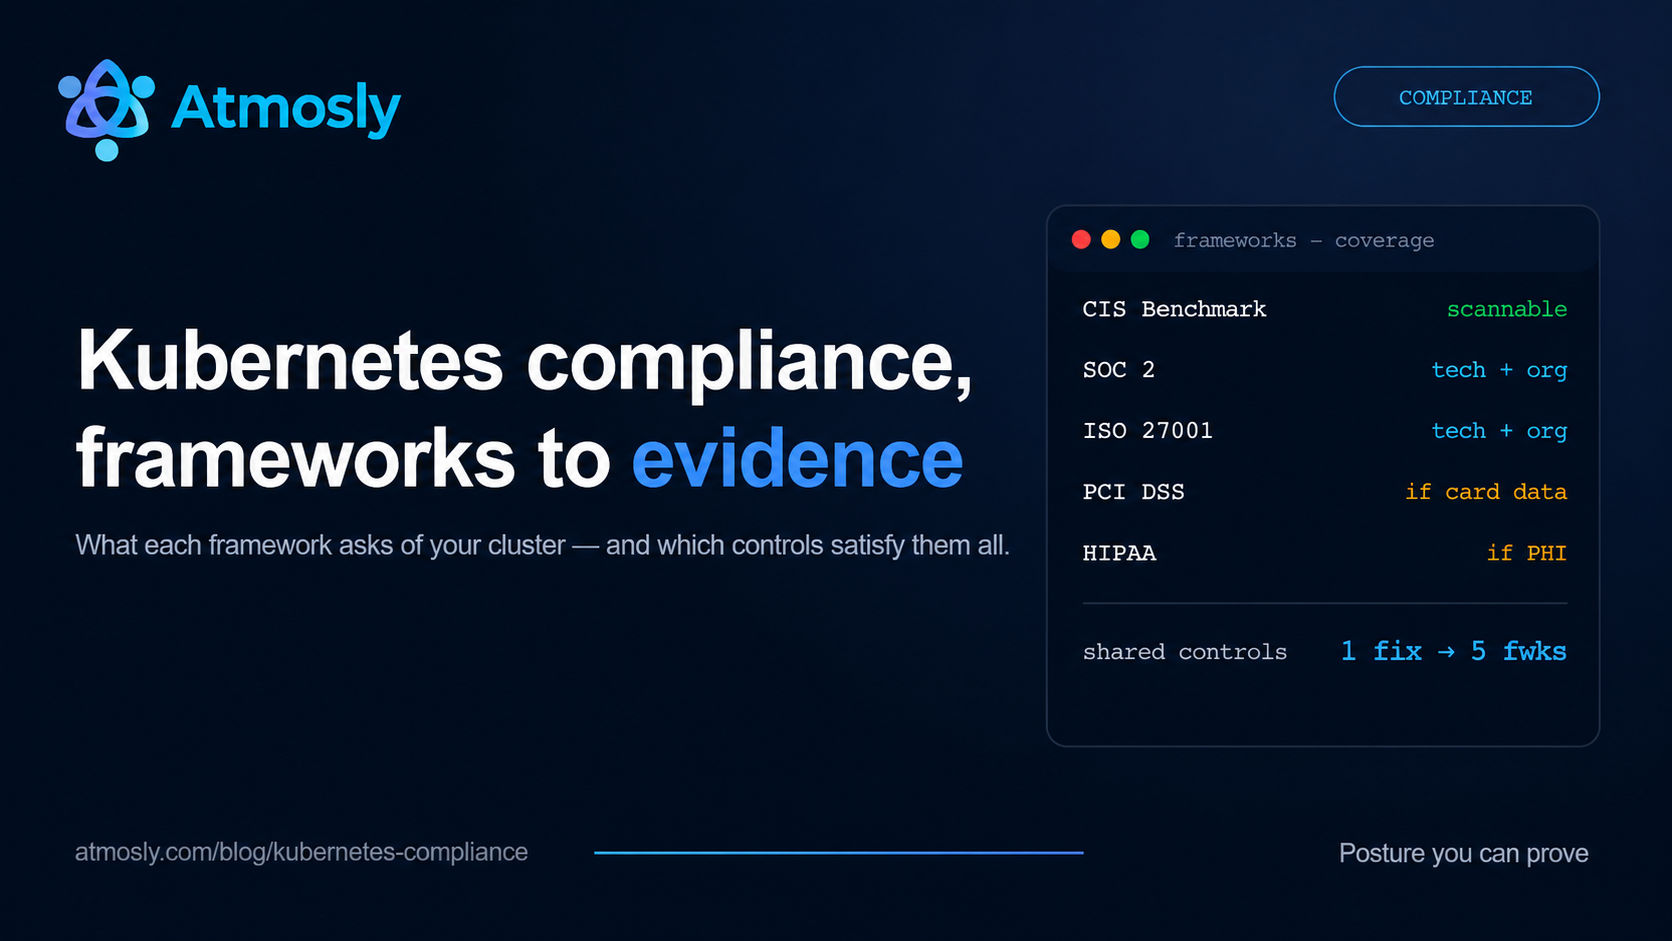
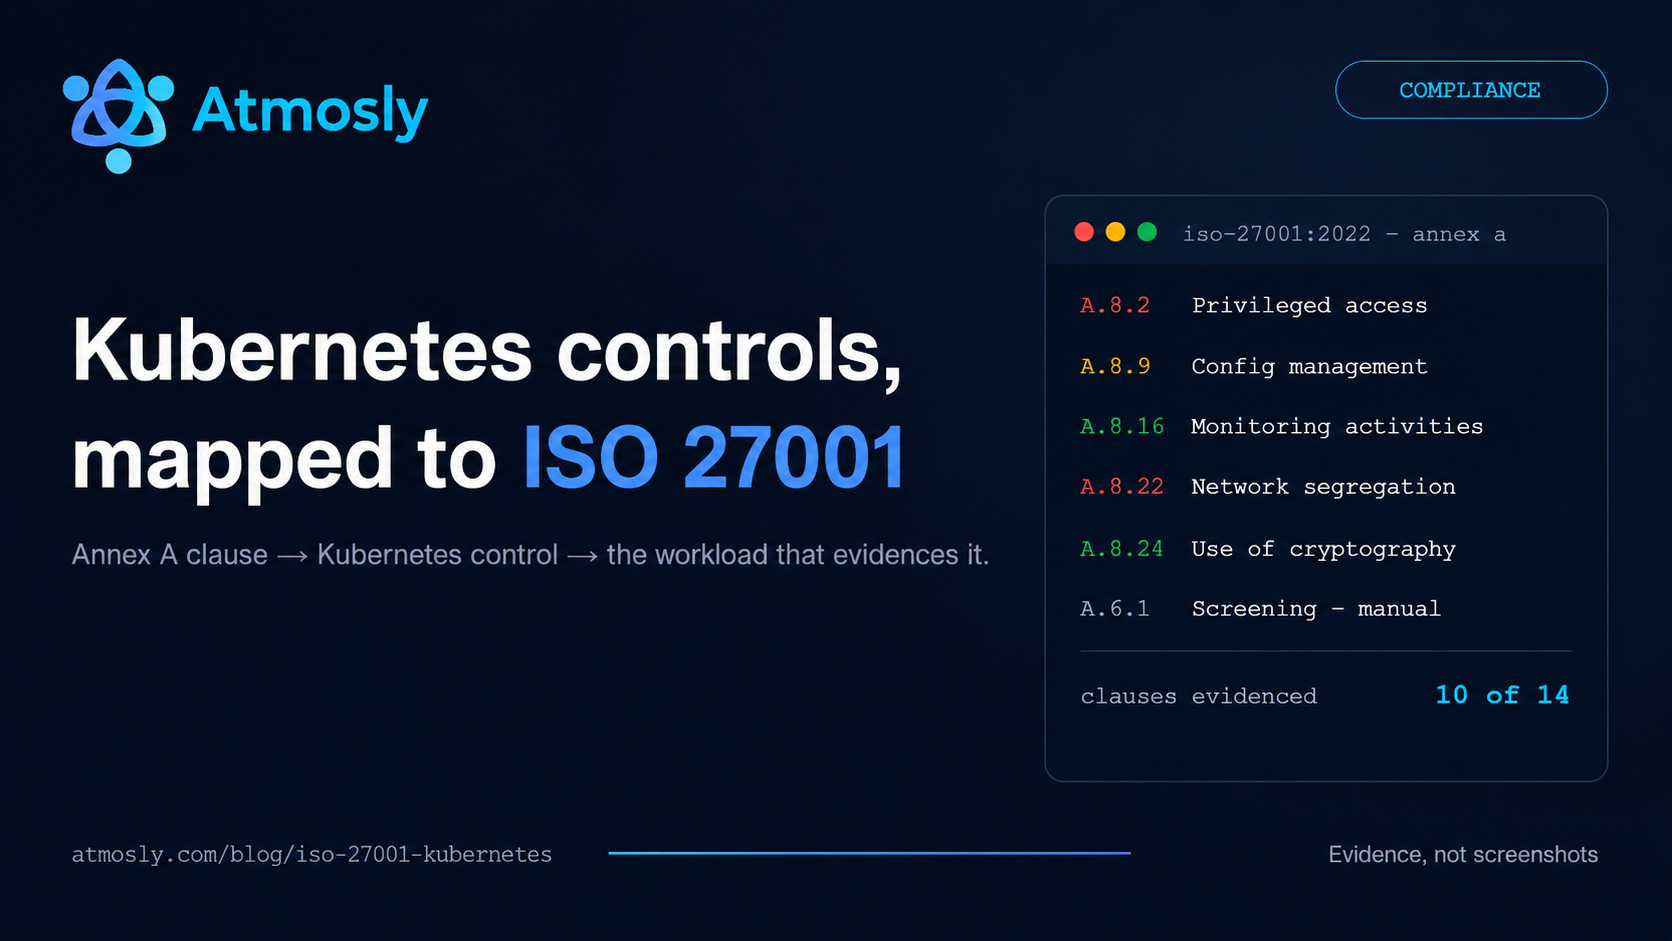
The compliance stakes are unambiguous: audit logging is the one technical control that appears in every major framework — SOC 2 CC7.2, ISO 27001 A.8.15, PCI DSS Requirement 10, HIPAA 164.312(b), and the CIS Kubernetes Benchmark's logging section. It is also, inconveniently, disabled by default on the most popular managed Kubernetes service. This guide covers the audit policy that balances signal against volume, enablement on EKS, GKE, and AKS, retention that survives an audit, and the alerts worth wiring up.
The Four Audit Levels
Every rule in a Kubernetes audit policy assigns one of four levels, and the level determines how much of each event is recorded. None drops the event entirely — used deliberately to silence high-churn noise like endpoint updates and lease renewals. Metadata records who, what verb, which object, and the outcome, but no payloads — the right default for most resources. Request adds the request body, showing what change was asked for. RequestResponse adds the response body too, and should be reserved for high-stakes writes like RBAC changes where you want the full before-and-after picture.
One rule matters more than all the others: secrets stay at Metadata, always. At Request level and above, the audit log records request payloads — which for secrets means recording the secret values themselves into your log pipeline. Metadata level still tells you who read or listed which secret and when, which is exactly what investigations and auditors need, without turning the audit trail into a second secrets store.
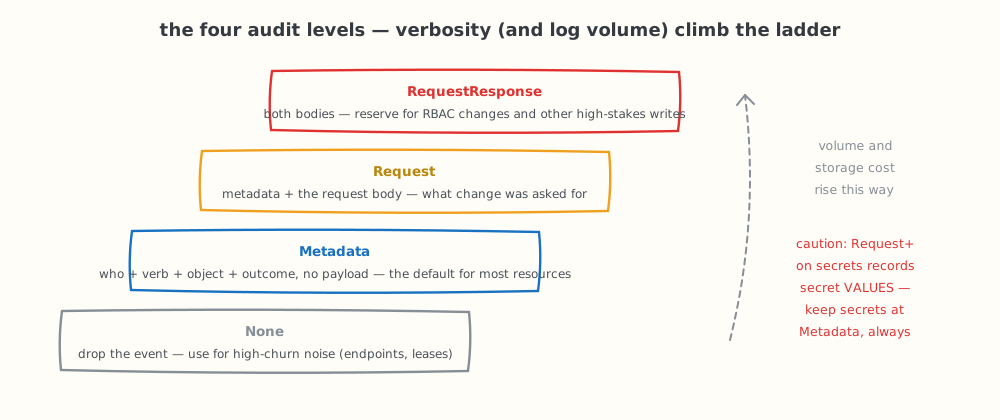
Volume climbs the ladder — and Request-level on secrets records the values themselves.
A Production Audit Policy
The audit policy is a YAML document the API server evaluates top-down, first match wins. This one covers the requests that matter for security and compliance while dropping the noise that makes naive policies unaffordable:
apiVersion: audit.k8s.io/v1
kind: Policy
# Don't log the request stage separately - one event per request
omitStages:
  - "RequestReceived"
rules:
  # 1. Secret access: identity and outcome only - NEVER payloads
  - level: Metadata
    resources:
      - group: ""
        resources: ["secrets", "configmaps"]
  # 2. RBAC changes: full request + response bodies
  - level: RequestResponse
    resources:
      - group: "rbac.authorization.k8s.io"
        resources: ["roles", "rolebindings", "clusterroles", "clusterrolebindings"]
  # 3. Interactive access to workloads
  - level: Metadata
    resources:
      - group: ""
        resources: ["pods/exec", "pods/attach", "pods/portforward"]
  # 4. Workload changes: what was asked for
  - level: Request
    verbs: ["create", "update", "patch", "delete"]
    resources:
      - group: ""
        resources: ["pods", "services", "serviceaccounts"]
      - group: "apps"
        resources: ["deployments", "daemonsets", "statefulsets"]
  # 5. Drop high-churn noise
  - level: None
    resources:
      - group: ""
        resources: ["endpoints"]
      - group: "coordination.k8s.io"
        resources: ["leases"]
  - level: None
    users: ["system:kube-proxy"]
  # 6. Everything else: metadata
  - level: Metadata
On a self-managed cluster, point the API server at it and configure local rotation as a buffer before shipping:
--audit-policy-file=/etc/kubernetes/audit-policy.yaml
--audit-log-path=/var/log/kubernetes/audit.log
--audit-log-maxage=30
--audit-log-maxbackup=10
--audit-log-maxsize=100
Enabling Audit Logs on EKS, GKE, and AKS
EKS: off by default — turn it on first. Control-plane logging, including the audit log, ships nothing until you enable it, which means a stock EKS cluster is generating no audit evidence at all. Enable the audit and authenticator log types so events flow to CloudWatch Logs:
aws eks update-cluster-config \
  --name prod-cluster \
  --logging '{"clusterLogging":[{"types":["audit","authenticator"],"enabled":true}]}'
Note that on managed control planes you consume the provider's audit policy rather than supplying your own — the levels above still matter for understanding what you receive, and for any self-managed or on-prem clusters you run alongside.
Audit logging is one of the controls a scan checks for you.
One-click posture scan against CIS, SOC 2 and ISO — free tier, read-only.
GKE: admin activity audit logs are on by default and free via Cloud Audit Logs; data-access logs (the equivalent of read events on objects) are opt-in and billable — turn them on for production clusters, because "who read the secret" is a data-access event.
AKS: audit logs are captured but only retained if you create a diagnostic setting routing the kube-audit (or lighter kube-audit-admin) category to a Log Analytics workspace or storage account. No diagnostic setting, no evidence.
In all three cases the working rule is the same: the provider generates the events, but you own switching them on, routing them somewhere durable, and paying for their retention. Auditors will ask for the configuration as well as the logs.
Retention: The Requirement Teams Miss
The default retention on managed log services is measured in days or weeks; compliance frameworks think in months and years. The floor each framework sets:
- SOC 2 Type II — logs must cover the full attestation period (typically 6–12 months); in practice, retain for the audit period plus a safety margin.
- PCI DSS Requirement 10 — explicit: twelve months of history, with three months immediately available.
- HIPAA — six-year documentation retention pushes healthcare teams toward long archives.
The affordable pattern on every cloud is the same: keep 30–90 days hot and queryable (CloudWatch, Cloud Logging, Log Analytics), then lifecycle everything to cheap object storage — S3/GCS/Blob with lifecycle rules — for the long tail.
Configure this the week you enable audit logging, because retention cannot be applied retroactively: logs that expired last quarter are gone from your evidence period forever.
Five Alerts Worth Wiring Up
Collected-but-never-read logs satisfy the letter of Requirement 10 and none of its spirit. Five queries cover the events that most often matter, whether you alert from CloudWatch, Loki, or a SIEM:
- Secret-access spikes. Bursts of
get/liston secrets from any single identity. - Cluster-scoped RBAC writes. Any change to ClusterRoles or ClusterRoleBindings — rare, high-stakes, and fully captured at RequestResponse by the policy above.
- Interactive access to production.
pods/execinto production namespaces. - Permission probing. Sustained 403 "forbidden" responses from one user or ServiceAccount — someone mapping what they can reach.
- Anonymous requests. Anything from
system:anonymous, which on a hardened cluster should simply never appear.
Each of these doubles as detection evidence for SOC 2 CC7.2 and ISO A.8.16 — an alert that fired, was investigated, and was closed is exactly the anomaly-response artifact auditors ask to see.
Where a Platform Trail Fits In
One precision worth stating plainly, since this is an Atmosly blog: Atmosly is not a Kubernetes audit-log collector — enabling, shipping, and retaining API-server audit logs is done with the cloud-native tooling above. What it contributes to the same evidence story sits one layer up:
- A platform audit trail. Every action taken through Atmosly — security scans run, remediation commands executed in its namespace-scoped terminal, RBAC roles created and expired — is recorded with actor and timestamp.
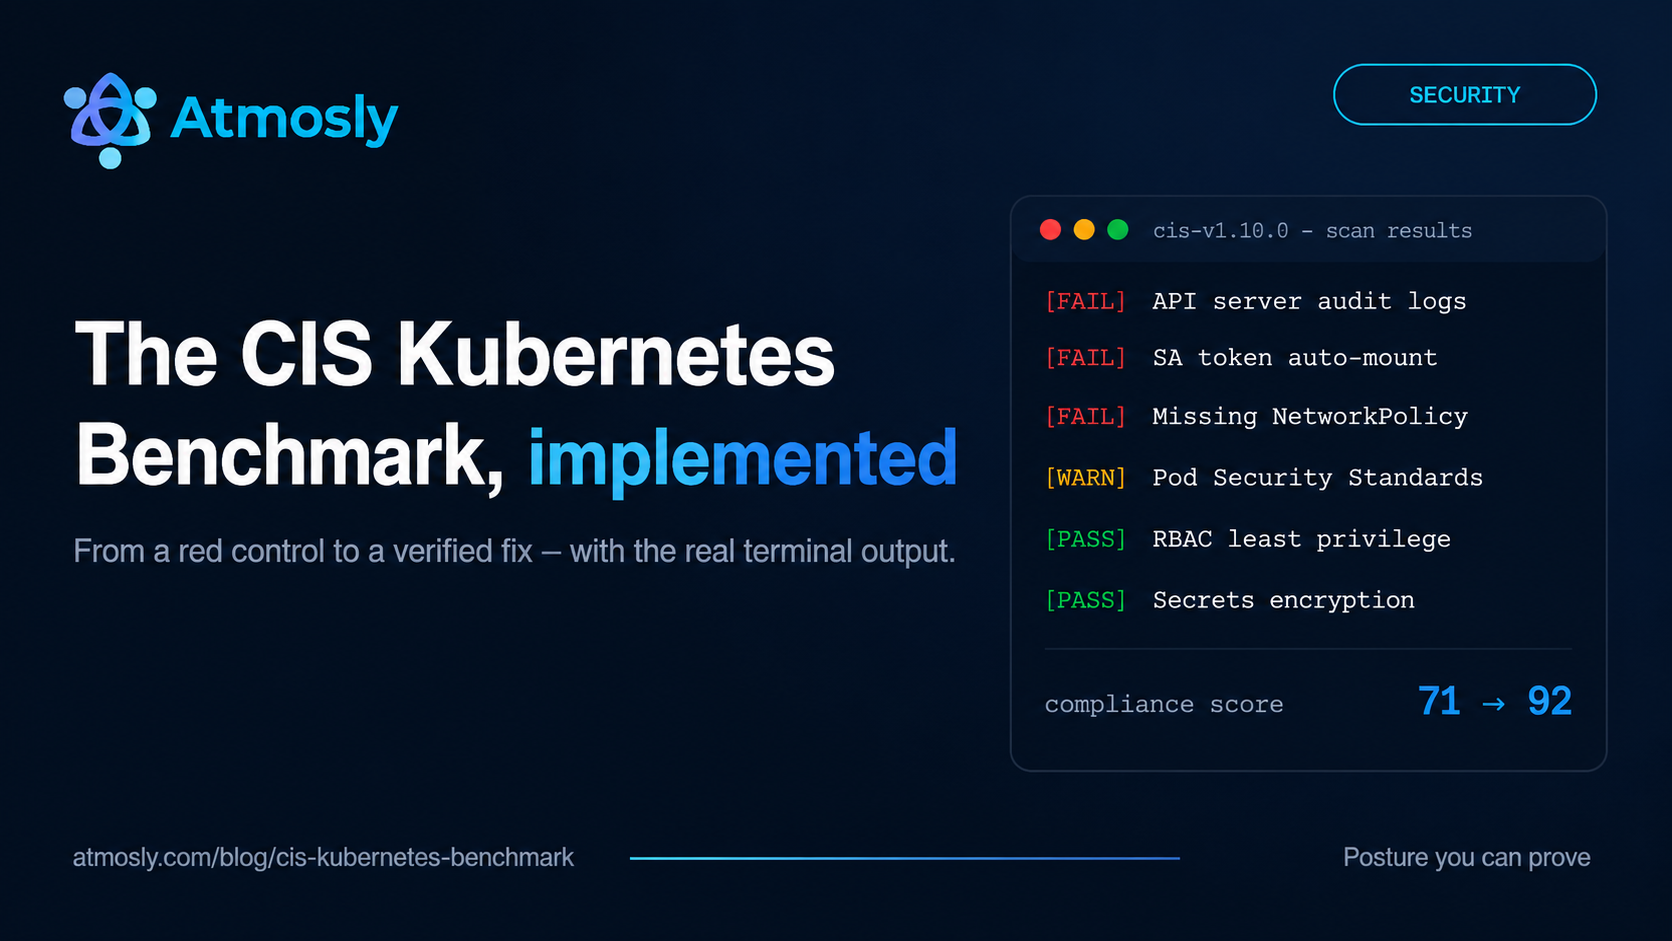
- Logging posture checks. The scan covers logging-related CIS controls, so a disabled audit log surfaces as a failed finding rather than a surprise during audit prep.
Auditors care about both layers: the API server's record of what happened in the cluster, and the platform's record of who drove the changes. The broader evidence workflow — scan, fix, re-scan, file — is covered in our Kubernetes compliance guide, and audit logging's place among the other 49 controls is in the Kubernetes security checklist.
Conclusion: Turn It On Before You Need It
Kubernetes audit logging is rare among security controls: it is nearly free to operate with a sensible policy, it is demanded by every compliance framework at once, and it is the one control you cannot add after the fact — the incident you'll want to investigate next quarter is only reconstructable if logging was on this quarter. Enable it on every production cluster this week, keep secrets at Metadata, route events to durable storage with audit-period retention, and wire up the five alerts.
Not sure whether your clusters would pass the logging controls today? Run a free Atmosly security scan — it checks audit and logging posture alongside the rest of CIS, SOC 2, and ISO 27001, and every finding arrives with the fix.