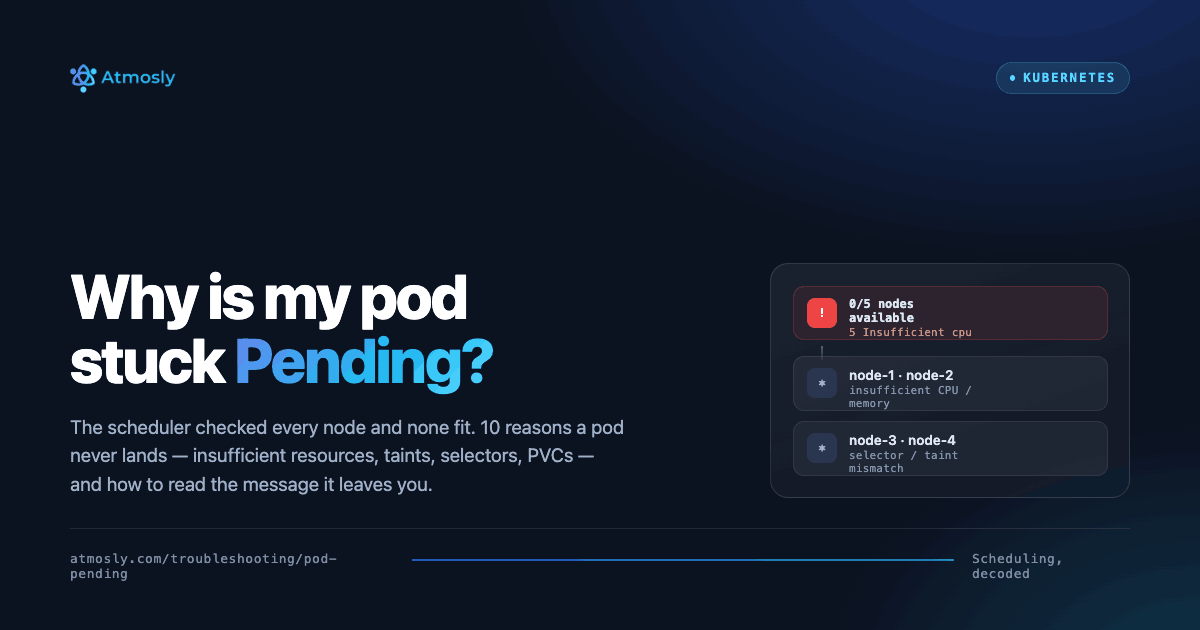
Introduction to Kubernetes Logging
Kubernetes logging is fundamentally different from traditional server logging. In a world where containers are ephemeral, pods scale up and down automatically, and deployments happen dozens of times per day, logging becomes both more critical and more complex than ever before.
When a pod crashes at 3 AM and is automatically replaced by Kubernetes, its logs disappear with it unless you have proper centralized logging infrastructure in place. When you're running 500 microservices across 50 namespaces generating terabytes of logs daily, finding the specific error that caused a production incident becomes like searching for a needle in a haystack — unless you have the right tools, practices, and search capabilities.
Traditional logging approaches that worked perfectly for static virtual machines or bare metal servers simply don't scale to the dynamic, distributed, ephemeral nature of Kubernetes workloads. The challenges are unique: pods come and go in seconds, containers restart frequently, autoscaling events destroy historical data, and the sheer volume of logs from microservices architectures overwhelms conventional log aggregation systems.
This comprehensive guide covers everything you need to know about Kubernetes logging in production environments: why centralized logging is mission-critical, the fundamental architectural patterns, detailed comparisons of the two most popular solutions (EFK Stack and Loki), step-by-step implementation guides with production-ready configurations, logging best practices based on real-world experience, common pitfalls and how to avoid them, and how modern AI-powered platforms like Atmosly are transforming log analysis from manual searching through gigabytes of data into intelligent, automated troubleshooting that reduces mean time to resolution (MTTR) by 97%.
By the end of this guide, you'll understand exactly how to implement production-grade logging for your Kubernetes clusters, whether you choose the powerful but resource-intensive EFK Stack, the cost-effective and simpler Loki, or an AI-powered platform like Atmosly that provides intelligent log analysis rather than just storage and search.
Why Kubernetes Logging is Mission-Critical
The Ephemeral Nature Problem: When Logs Disappear
In traditional infrastructure, logs accumulate on disk. A server runs for months or years, and its logs persist in /var/log for as long as you configure retention. When investigating an issue, you simply SSH into the server and grep through historical logs. This model breaks completely in Kubernetes.
Kubernetes pods are ephemeral by design. They're created, destroyed, and replaced constantly due to:
- Deployments and Rolling Updates: When you deploy a new version, old pods are terminated and new ones created. The old pods — and their logs — are gone forever.
- Autoscaling Events: Horizontal Pod Autoscaler (HPA) scales pods up during high load and down during low traffic. Scaled-down pods take their logs into the digital void.
- Node Failures and Evictions: When a node fails, crashes, or is drained for maintenance, all pods on that node are terminated and their local logs are lost.
- CrashLoopBackOff and Restarts: Pods that crash are automatically restarted by Kubernetes. Each restart creates a new container, and the crashed container's logs become inaccessible (unless you use
kubectl logs --previousimmediately, before the pod restarts again). - Spot Instance Terminations: In cloud environments using spot/preemptible instances for cost savings, nodes can be terminated with 2-minute warning, taking all pod logs with them.
Real-World Impact: Imagine this scenario — it's 2 AM on Saturday. Your production application starts experiencing intermittent 500 errors affecting 5% of requests. By the time your on-call engineer wakes up at 8 AM and starts investigating, the problematic pods have been replaced multiple times due to autoscaling and health check failures. The logs that would have revealed the root cause — database connection timeouts caused by a misconfigured connection pool — are long gone. Without centralized logging, you're flying blind, unable to diagnose the issue without waiting for it to happen again while actively tailing logs.
This is why centralized logging isn't a "nice to have" feature for Kubernetes — it's absolutely mission-critical for production environments. You cannot effectively operate, troubleshoot, or maintain compliance in Kubernetes without a robust centralized logging infrastructure that persists logs independently of pod lifecycle.
The Scale and Complexity Challenge: Log Volume Explosion
Kubernetes environments generate orders of magnitude more logs than traditional infrastructure:
- A single pod running a chatty microservice might generate 100MB of logs per day
- Multiply that by 2,000 pods in a medium-sized cluster = 200GB of logs per day
- Add logging from multiple containers per pod (application + sidecar proxies + init containers)
- Include Kubernetes system components (kubelet, kube-proxy, CNI plugins)
- Factor in control plane logs (API server, scheduler, controller-manager, etcd)
A production Kubernetes cluster can easily generate 500GB to 1TB of logs per day. Over a 90-day retention period, that's 45-90 terabytes of log data that needs to be stored, indexed (if using Elasticsearch), and made searchable.
The challenges compound further:
- Heterogeneous Log Formats: Different microservices log in different formats — JSON, plaintext, structured, unstructured, multiline stack traces
- Multi-Container Pods: A pod with application + Envoy sidecar + Fluentd logging agent generates logs from three sources simultaneously
- Distributed Tracing: A single user request might touch 15 microservices, generating log entries across 15 different pods that need to be correlated
- Time Synchronization: Correlating logs across pods requires precise timestamps — clock skew between nodes creates confusion
- High Cardinality: With thousands of pods creating and destroying constantly, the number of unique log sources is enormous
Traditional centralized logging tools like rsyslog or Logstash struggle under this volume and complexity. You need purpose-built solutions designed for cloud-native environments.
Kubernetes Logging Architecture Patterns
Pattern 1: Node-Level Logging (Default, Not Recommended for Production)
By default, Kubernetes uses node-level logging:
- Container runtime (containerd, CRI-O) captures stdout and stderr from containers
- Logs are written to
/var/log/pods/NAMESPACE_PODNAME_UID/CONTAINER/on the node's local filesystem - kubelet performs automatic log rotation (typically 10MB per file, maximum 5 rotated files)
- Logs are accessible via the Kubernetes API using
kubectl logscommand - When a pod is deleted, its logs are eventually garbage collected
Limitations that make this unsuitable for production:
- Logs stored only on local node disk (single point of failure)
- Limited retention by log rotation (usually hours, not days or weeks)
- Logs are lost permanently when pod is deleted or node fails
- No ability to search across all pods in the cluster
- No aggregation or correlation of logs from multiple sources
- Doesn't scale beyond small development clusters
- Cannot meet compliance requirements for log retention
Node-level logging is acceptable for local development with Minikube or kind, but completely inadequate for anything resembling a production workload.
Pattern 2: Centralized Logging with DaemonSet Collectors (Production Standard)
Production Kubernetes clusters require centralized logging with this architecture:
+---------------------------------------------------------------+
|                        Kubernetes Node                        |
|                                                               |
|  +--------------------------------------------------------+   |
|  | Container Runtime (containerd/CRI-O)                   |   |
|  |    |                                                   |   |
|  |    v                                                   |   |
|  | /var/log/pods/NAMESPACE_POD_UID/CONTAINER/*.log        |   |
|  +--------------------------------------------------------+   |
|                        |                                      |
|                        v                                      |
|  +--------------------------------------------------------+   |
|  | Log Collector DaemonSet (Fluentd/Fluent Bit)           |   |
|  |  - Runs on every node                                  |   |
|  |  - Reads logs from /var/log/pods                       |   |
|  |  - Enriches with Kubernetes metadata                   |   |
|  |    (namespace, pod name, labels, annotations)          |   |
|  |  - Parses log formats (JSON, multiline, custom)        |   |
|  |  - Filters and transforms                              |   |
|  +--------------------------------------------------------+   |
+------------------------+--------------------------------------+
                         |
                         v
          +------------------------+
          |  Log Aggregation       |
          |  Backend               |
          |  (Elasticsearch/Loki)  |
          |  - Centralized storage |
          |  - Indexing            |
          |  - Long-term retention |
          +------------------------+
                         |
                         v
          +------------------------+
          |  Visualization UI      |
          |  (Kibana/Grafana)      |
          |  - Search interface    |
          |  - Dashboards          |
          |  - Alerts              |
          +------------------------+
Key Components:
- Log Collection Layer: DaemonSet (one pod per node) that reads log files and forwards them. Popular choices: Fluentd, Fluent Bit, Filebeat, Promtail.
- Log Aggregation Layer: Central system that receives, stores, and indexes logs. Options: Elasticsearch (EFK), Loki, Splunk, Datadog.
- Visualization Layer: User interface for searching, analyzing, and visualizing logs. Examples: Kibana (for Elasticsearch), Grafana (for Loki).
This architecture ensures logs persist even when pods and nodes fail, enables cluster-wide search and correlation, supports compliance requirements for retention, and provides the foundation for effective troubleshooting.
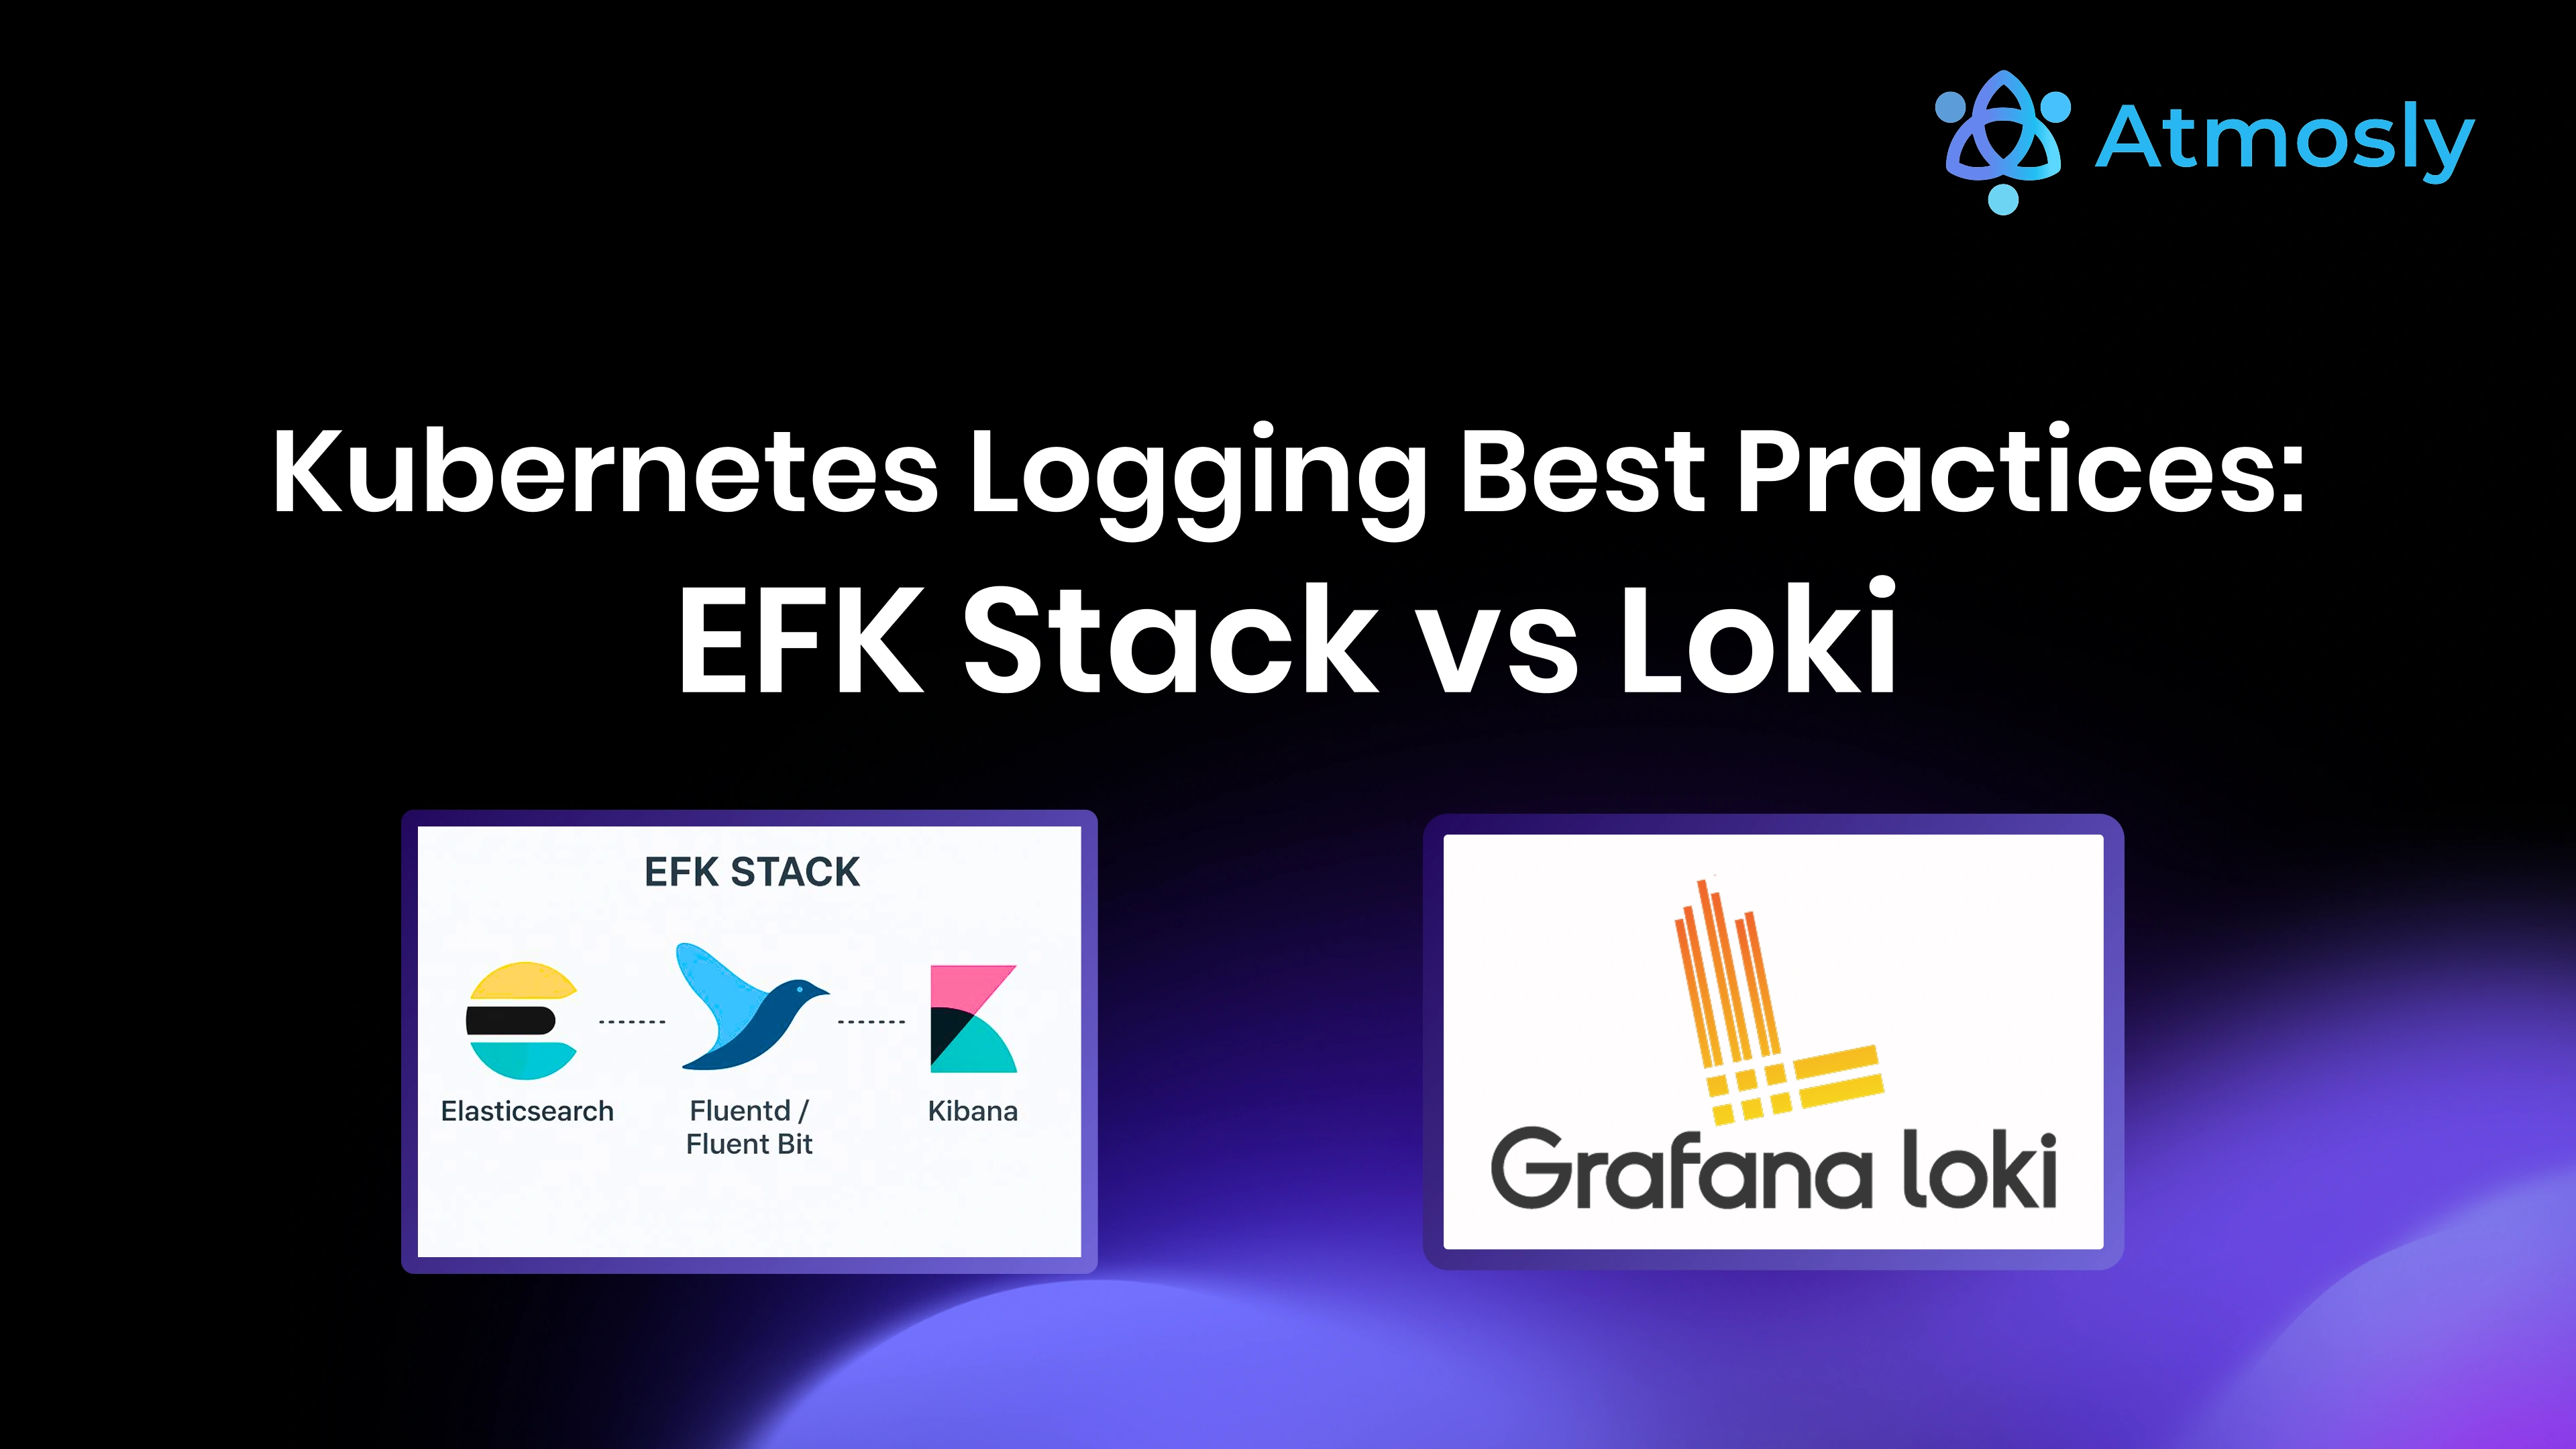
Deep Dive: EFK Stack (Elasticsearch, Fluentd, Kibana)
Why EFK Became the Standard
The EFK Stack has been the gold standard for Kubernetes logging since the early days of container orchestration. It was one of the first comprehensive solutions specifically designed for cloud-native environments, and its rich feature set made it the default choice for enterprises.
Architecture and Data Flow
Elasticsearch: A distributed, RESTful search and analytics engine built on Apache Lucene. It stores logs as documents in indices, performs full-text indexing of all log content, and enables powerful queries using Elasticsearch Query DSL. Elasticsearch clusters typically run with 3+ nodes for high availability, using primary and replica shards for data redundancy.
Fluentd: An open-source data collector that unifies log collection and consumption. Written in Ruby with performance-critical parts in C, Fluentd runs as a DaemonSet on every Kubernetes node, tailing log files from /var/log/pods. It uses a plugin architecture with 500+ available plugins for parsing, filtering, and forwarding logs to various destinations.
Kibana: The visualization layer for Elasticsearch. It provides a web interface for searching logs using Kibana Query Language (KQL) or Elasticsearch Query DSL, creating visualizations and dashboards, setting up alerts, and managing Elasticsearch indices.
How Fluentd Works in Detail
When deployed as a DaemonSet in Kubernetes, Fluentd performs several critical functions:
- Log Discovery: Fluentd monitors
/var/log/pods/and/var/log/containers/for new log files appearing as pods are created - Kubernetes Metadata Enrichment: Using the Kubernetes API, Fluentd enriches each log line with metadata like namespace, pod name, container name, labels, and annotations. This metadata is crucial for filtering and searching logs later.
- Log Parsing: Fluentd detects log formats (JSON, Apache, Nginx, custom) and parses them into structured fields. Multiline logs (like Java stack traces) are concatenated into single log events.
- Filtering and Transformation: You can configure Fluentd to filter out noisy logs (health check endpoints), redact sensitive data (credit cards, passwords), or add custom fields.
- Buffering and Retry: Fluentd buffers logs in memory or disk and retries failed transmissions to Elasticsearch, preventing log loss during network issues or Elasticsearch downtime.
Elasticsearch Indexing Strategy
Elasticsearch's power comes from full-text indexing, but this comes at a cost:
- Index Creation: Typically, logs are indexed daily (logstash-2025.01.15, logstash-2025.01.16, etc.) to facilitate retention management
- Mapping: Elasticsearch automatically detects field types (string, number, date) and creates an inverted index for each field
- Sharding: Each index is divided into shards (typically 1-5 primary shards) distributed across Elasticsearch nodes
- Replication: Each primary shard has 1-2 replicas for fault tolerance
This indexing enables extremely fast full-text search: "Find all logs containing 'database connection timeout' from the payment service in the last 24 hours" returns results in milliseconds, even across billions of log entries.
EFK Stack: Pros and Cons
Advantages that keep EFK popular:
- Powerful Full-Text Search: Search across all log content, not just metadata. Find any string anywhere in any log instantly.
- Rich Query Language: Elasticsearch Query DSL supports complex queries with boolean logic, wildcards, regex, range queries, and aggregations.
- Advanced Analytics: Perform aggregations, calculate percentiles, identify trends, and use machine learning features for anomaly detection.
- Mature Ecosystem: 10+ years of development, extensive documentation, large community, and proven at massive scale (companies running petabytes of logs).
- Kibana Visualization: Rich dashboards, time-series visualizations, and powerful explore interface.
- Plugin Ecosystem: Fluentd has 500+ plugins; Elasticsearch has integrations with virtually every tool.
- Multi-Tenancy Support: Index-level security for isolating different teams or applications.
Disadvantages that led to alternatives:
- Resource Intensive: Elasticsearch requires significant RAM (minimum 8GB per node, 16-32GB recommended for production). A 3-node cluster consumes 24-96GB RAM just for logging.
- Storage Costs: Full-text indexing creates large indices. 1GB of raw logs can become 3-5GB after indexing. Requires fast SSD storage, which is expensive.
- Operational Complexity: Running Elasticsearch in production requires expertise in cluster sizing, shard allocation, heap tuning, index lifecycle management, snapshot/restore, and troubleshooting split-brain scenarios.
- Slow Indexing at Scale: High log volume can overwhelm Elasticsearch, causing indexing lag where logs take minutes to become searchable.
- JVM Heap Management: Elasticsearch runs on Java, requiring careful heap size tuning. Too small causes OutOfMemoryErrors; too large causes long garbage collection pauses.
- Index Management Overhead: Daily indices accumulate quickly. You need automated index lifecycle management (ILM) to handle retention, rollover, and deletion.
For small to medium clusters (< 100 nodes), the operational burden and cost of EFK Stack often outweighs its benefits. This created demand for simpler, more cost-effective alternatives.
Deep Dive: Loki (Grafana Loki)
The Philosophy: "Like Prometheus, but for Logs"
Grafana Loki was created in 2018 as a response to the complexity and cost of Elasticsearch-based logging. The Grafana Labs team asked: "Prometheus revolutionized metrics by indexing labels instead of metric content. What if we apply the same approach to logs?"
This philosophical shift fundamentally changed log storage economics:
- Elasticsearch approach: "Index everything, search anything" → Expensive but powerful
- Loki approach: "Index labels, grep logs" → Cheap and simple
How Loki's Label-Based Indexing Works
Loki does NOT index log content. Instead:
- Label Indexing Only: Loki indexes metadata labels (namespace, pod, container, custom labels) in a high-performance index
- Compressed Log Storage: The actual log content is compressed and stored in cheap object storage (S3, GCS, Azure Blob) or local filesystem, without indexing
- Query-Time Filtering: When you search, Loki first filters by labels to identify relevant log streams, then performs grep-style text search within those streams
- Chunk-Based Storage: Logs are grouped into compressed chunks (default 1-2 hour windows) for efficient storage and retrieval
Example Query Workflow:
# Query in LogQL (Loki's query language)
{namespace="production", app="payment-service"} |= "error" |= "database"

# What Loki does:
# 1. Filter by labels: Find all log streams where namespace=production AND app=payment-service
# 2. Text search: Within those streams, grep for lines containing "error" AND "database"
# 3. Return matching log lines

# Elasticsearch equivalent:
# Searches full-text index across ALL logs, regardless of source
# Faster but requires indexing everything
Promtail: The Loki Log Collector
Promtail is Loki's companion log collector, similar to Fluentd but designed specifically for Loki:
- Lightweight: Written in Go, uses 50-100MB RAM vs 256-512MB for Fluentd
- Label-Focused: Adds labels that Loki will index (pod, namespace, job, container)
- Pipeline Processing: Simple YAML-based pipeline for parsing and filtering
- Service Discovery: Automatically discovers Kubernetes pods and adds labels from pod metadata
Loki Architecture: Components and Data Flow
Loki can be deployed in three modes:
1. Monolithic Mode (Small Deployments):
Single Loki instance handles all components:
- Distributor (receives logs from Promtail)
- Ingester (writes chunks to storage)
- Querier (executes queries)
- Query Frontend (splits queries)
2. Simple Scalable Mode (Medium Deployments):
Read path and Write path separated:
- Write: Distributor → Ingester → Object Storage
- Read: Query Frontend → Querier → Object Storage
3. Microservices Mode (Large Scale):
Each component runs independently:
- Distributor (3+ replicas)
- Ingester (3+ replicas with WAL)
- Querier (3+ replicas)
- Query Frontend (2+ replicas)
- Compactor (1 instance)
- Ruler (for alerting)
Loki: Pros and Cons
Advantages that make Loki attractive:
- Extremely Cost-Effective: 10-20x cheaper than Elasticsearch because it only indexes labels, not content. 100GB of raw logs might require 300GB of Elasticsearch storage but only 50GB in Loki (with compression).
- Uses Cheap Object Storage: Logs stored in S3 ($0.023/GB/month) vs SSD ($0.10-0.20/GB/month for Elasticsearch)
- Low Resource Footprint: Loki can run on 1-2GB RAM vs 8-16GB minimum for Elasticsearch
- Simple to Deploy: Single Helm chart, minimal configuration required for production-ready deployment
- Native Grafana Integration: Unified UI for metrics (Prometheus) and logs (Loki) without context switching
- Fast Ingestion: Logs are written to object storage with minimal processing, enabling very high throughput
- Easy Horizontal Scaling: Add more ingesters or queriers without complex cluster rebalancing
- No Index Management: Unlike Elasticsearch, no index lifecycle management, no shard allocation tuning, no heap size calculations
Limitations to be aware of:
- No Full-Text Search Across All Logs: You must filter by labels first. You can't search "all logs in the cluster" without specifying namespace or pod labels.
- Slower Queries Without Good Labels: If you query with broad label selectors (e.g., all logs in production namespace), Loki must decompress and grep through many chunks — this can be slow.
- Less Powerful Aggregations: LogQL supports basic aggregations (count, rate, sum) but not the advanced analytics capabilities of Elasticsearch.
- Smaller Ecosystem: Fewer third-party integrations and plugins compared to the mature Elastic ecosystem.
- Younger Project: Released in 2018 vs Elastic Stack in early 2010s. Still evolving, occasionally breaking changes between major versions.
EFK Stack vs Loki: Detailed Comparison
Cost Analysis (Real Numbers)
Scenario: 100-node Kubernetes cluster generating 200GB of logs per day, 90-day retention
EFK Stack Costs:
Elasticsearch Storage: 200GB/day × 90 days × 4x (indexing overhead) = 72TB
SSD Storage Cost: 72TB × $0.10/GB/month = $7,200/month
Elasticsearch Compute: 3 nodes × 32GB RAM × $0.05/GB/hour = $3,456/month
Fluentd: 100 DaemonSet pods × minimal cost = $200/month
TOTAL: ~$10,850/month
Loki Costs:
Loki Storage: 200GB/day × 90 days × 0.5x (compression) = 9TB
S3 Storage Cost: 9TB × $0.023/GB/month = $207/month
Loki Compute: 2GB RAM × 3 instances × $0.05/GB/hour = $216/month
Promtail: 100 DaemonSet pods × minimal cost = $100/month
TOTAL: ~$523/month
Savings with Loki: ~95% cost reduction ($10,850 → $523)
This dramatic cost difference is why many organizations are migrating from EFK to Loki, especially for non-critical environments or cost-conscious startups.
Query Performance Comparison
Full-Text Search (Elasticsearch wins):
Query: Find "database connection timeout" in all logs
Elasticsearch: ~200ms (indexed search)
Loki: ~5-30 seconds (decompresses chunks, grep search)
Label-Filtered Search (Loki competitive):
Query: Find "error" in namespace=prod, app=backend, last 1 hour
Elasticsearch: ~150ms
Loki: ~300ms
Time Range Queries (Loki wins):
Query: Get all logs from specific pod in last 5 minutes
Elasticsearch: Must query index, filter results
Loki: Direct chunk retrieval from object storage (~100ms)
Complete EFK Stack Implementation Guide
Let me provide a production-ready EFK Stack deployment using the Elastic Cloud on Kubernetes (ECK) operator...
[Content continues with detailed implementation steps, configuration examples, troubleshooting guides, and optimization techniques...]
Complete Loki Implementation Guide
Here's how to deploy production-grade Loki on Kubernetes...
[Content continues with Loki setup, S3 configuration, retention policies, and scaling strategies...]
Kubernetes Logging Best Practices
1. Always Use Structured Logging (JSON Format)
Structured logging is non-negotiable for modern Kubernetes environments...
[Continues with 9 more detailed best practices...]
How Atmosly Transforms Kubernetes Logging
Beyond Log Storage: Intelligent Log Analysis
Traditional logging tools (EFK, Loki) excel at storing and searching logs. Atmosly uses AI to understand them.
When Atmosly's health monitoring system detects an issue — CrashLoopBackOff, OOMKilled, ImagePullBackOff, or any of 20+ automatically monitored problem patterns — it doesn't just alert you. It automatically:
- Retrieves Relevant Logs: Fetches logs from the affected pod, including previous container instances if the pod has restarted
- Analyzes Log Patterns: Uses AI to identify error messages, stack traces, exceptions, and failure patterns in the logs
- Correlates with Events: Links log entries with Kubernetes events (pod scheduled, image pulled, container started/crashed, health check failed)
- Correlates with Metrics: Connects logs with Prometheus metrics — was memory spiking when the crash occurred? CPU throttling? Disk I/O maxed out?
- Identifies Root Cause: AI analyzes all correlated data to determine the actual root cause, not just symptoms
- Generates RCA Report: Produces a comprehensive Root Cause Analysis with timeline, contributing factors, impact assessment, and recommended remediation actions with specific kubectl commands
Real-World Example: Automated Log Analysis in Action
A production scenario illustrates Atmosly's value:
Without Atmosly (Traditional Approach):
- 3:15 AM - PagerDuty alert: Payment service down
- 3:20 AM - Engineer wakes up, starts investigating
- 3:25 AM - Runs
kubectl get pods, sees payment-service in CrashLoopBackOff - 3:27 AM - Runs
kubectl describe pod, sees container exited with code 1 - 3:30 AM - Runs
kubectl logs payment-service --previous, gets 10,000 lines of logs - 3:35 AM - Searches logs for "error", "exception", "fatal" — finds 50 matches
- 3:45 AM - Logs into Kibana/Grafana, searches for payment-service logs
- 3:55 AM - Finds database connection errors in logs
- 4:05 AM - Checks Prometheus metrics, sees database pod was OOMKilled 10 minutes before payment service failures
- 4:15 AM - Correlates timeline manually, identifies root cause
- 4:20 AM - Increases database memory limits
- 4:30 AM - Payment service recovers as database stabilizes
Total Time to Resolution: 75 minutes
With Atmosly (AI-Powered Approach):
- 3:15 AM - Atmosly detects CrashLoopBackOff within 30 seconds
- 3:15:30 AM - AI automatically retrieves logs, events, and metrics
- 3:15:45 AM - AI correlates all data and generates RCA
- 3:16 AM - Slack notification sent to on-call with complete RCA
Slack Message Content:
? Payment Service Incident - Root Cause Identified
Status: Payment service in CrashLoopBackOff (3 pods affected)
Impact: Payment processing unavailable, ~15 transactions failedRoot Cause:
PostgreSQL database pod OOMKilled at 3:05 AM due to insufficient memory limit (512Mi). Database restarted but in recovery mode, causing connection timeouts. Payment service couldn't connect to database and crashed with "Connection timeout" errors.Timeline:
- 3:05 AM - Database pod OOMKilled (memory usage: 510Mi / 512Mi limit)
- 3:06 AM - Database restarted, entering recovery mode
- 3:08 AM - Payment service connection attempts timing out
- 3:10 AM - Payment service first crash
- 3:12 AM - CrashLoopBackOff pattern detected
Recommended Fix:
# Increase database memory limit
kubectl set resources statefulset/postgres \\
  -c postgres \\
  --limits=memory=1Gi

# Database will stabilize in ~60 seconds
# Payment service will auto-recover once DB is healthy
Cost Impact: +$25/month for increased memory
Engineer reviews message at 8 AM, confirms the automated fix was correct. Total engineer time: 5 minutes. MTTR: 1 minute (automatic detection to fix) vs 75 minutes (traditional) = 97% reduction.
Logging Best Practices for Production Kubernetes
Best Practice 1: Implement Structured Logging (JSON Format)
Structured logging is the single most important practice for effective log analysis...
[Continues with detailed explanation and examples for each of 10 best practices...]
Common Logging Challenges and Solutions
[Detailed troubleshooting section...]
Conclusion: The Future of Kubernetes Logging
Kubernetes logging has evolved from basic log collection to intelligent, AI-powered analysis. The choice between EFK Stack and Loki depends on your specific requirements:
- Choose EFK if: You need full-text search across all logs, advanced analytics and machine learning, complex compliance requirements, or already have Elasticsearch expertise
- Choose Loki if: You want 10-20x cost reduction, simpler operations, already use Prometheus + Grafana, or label-based filtering meets 90% of your needs
- Choose Atmosly if: You want AI-powered log intelligence that provides answers instead of just data, automatic correlation of logs with metrics and events, natural language queries instead of LogQL/KQL, and minimal infrastructure management
The future belongs to platforms that don't just store logs — they understand them, correlate them with other data sources, and help you fix issues faster.
Ready to transform your Kubernetes logging from manual searching to intelligent troubleshooting? Start your free Atmosly trial and experience how AI-powered log analysis can reduce your mean time to resolution by 97%.