Introduction
In the cloud-native world of 2026, Kubernetes has become the operating system of the internet. However, interacting with it remains a polarizing topic. For years, the command-line interface (CLI) specifically kubectl was the only tool a "real" engineer needed. But as clusters have grown from dozens of nodes to thousands, and microservices counts have exploded into the hundreds, the raw CLI has hit its limits in terms of cognitive load and observability.
Enter the Kubernetes User Interface (UI). Whether it's a sleek desktop application, a lightning-fast terminal UI (TUI), or a web-based dashboard, these tools promise to democratize cluster management, speed up troubleshooting, and provide the "single pane of glass" that platform teams desperately need.
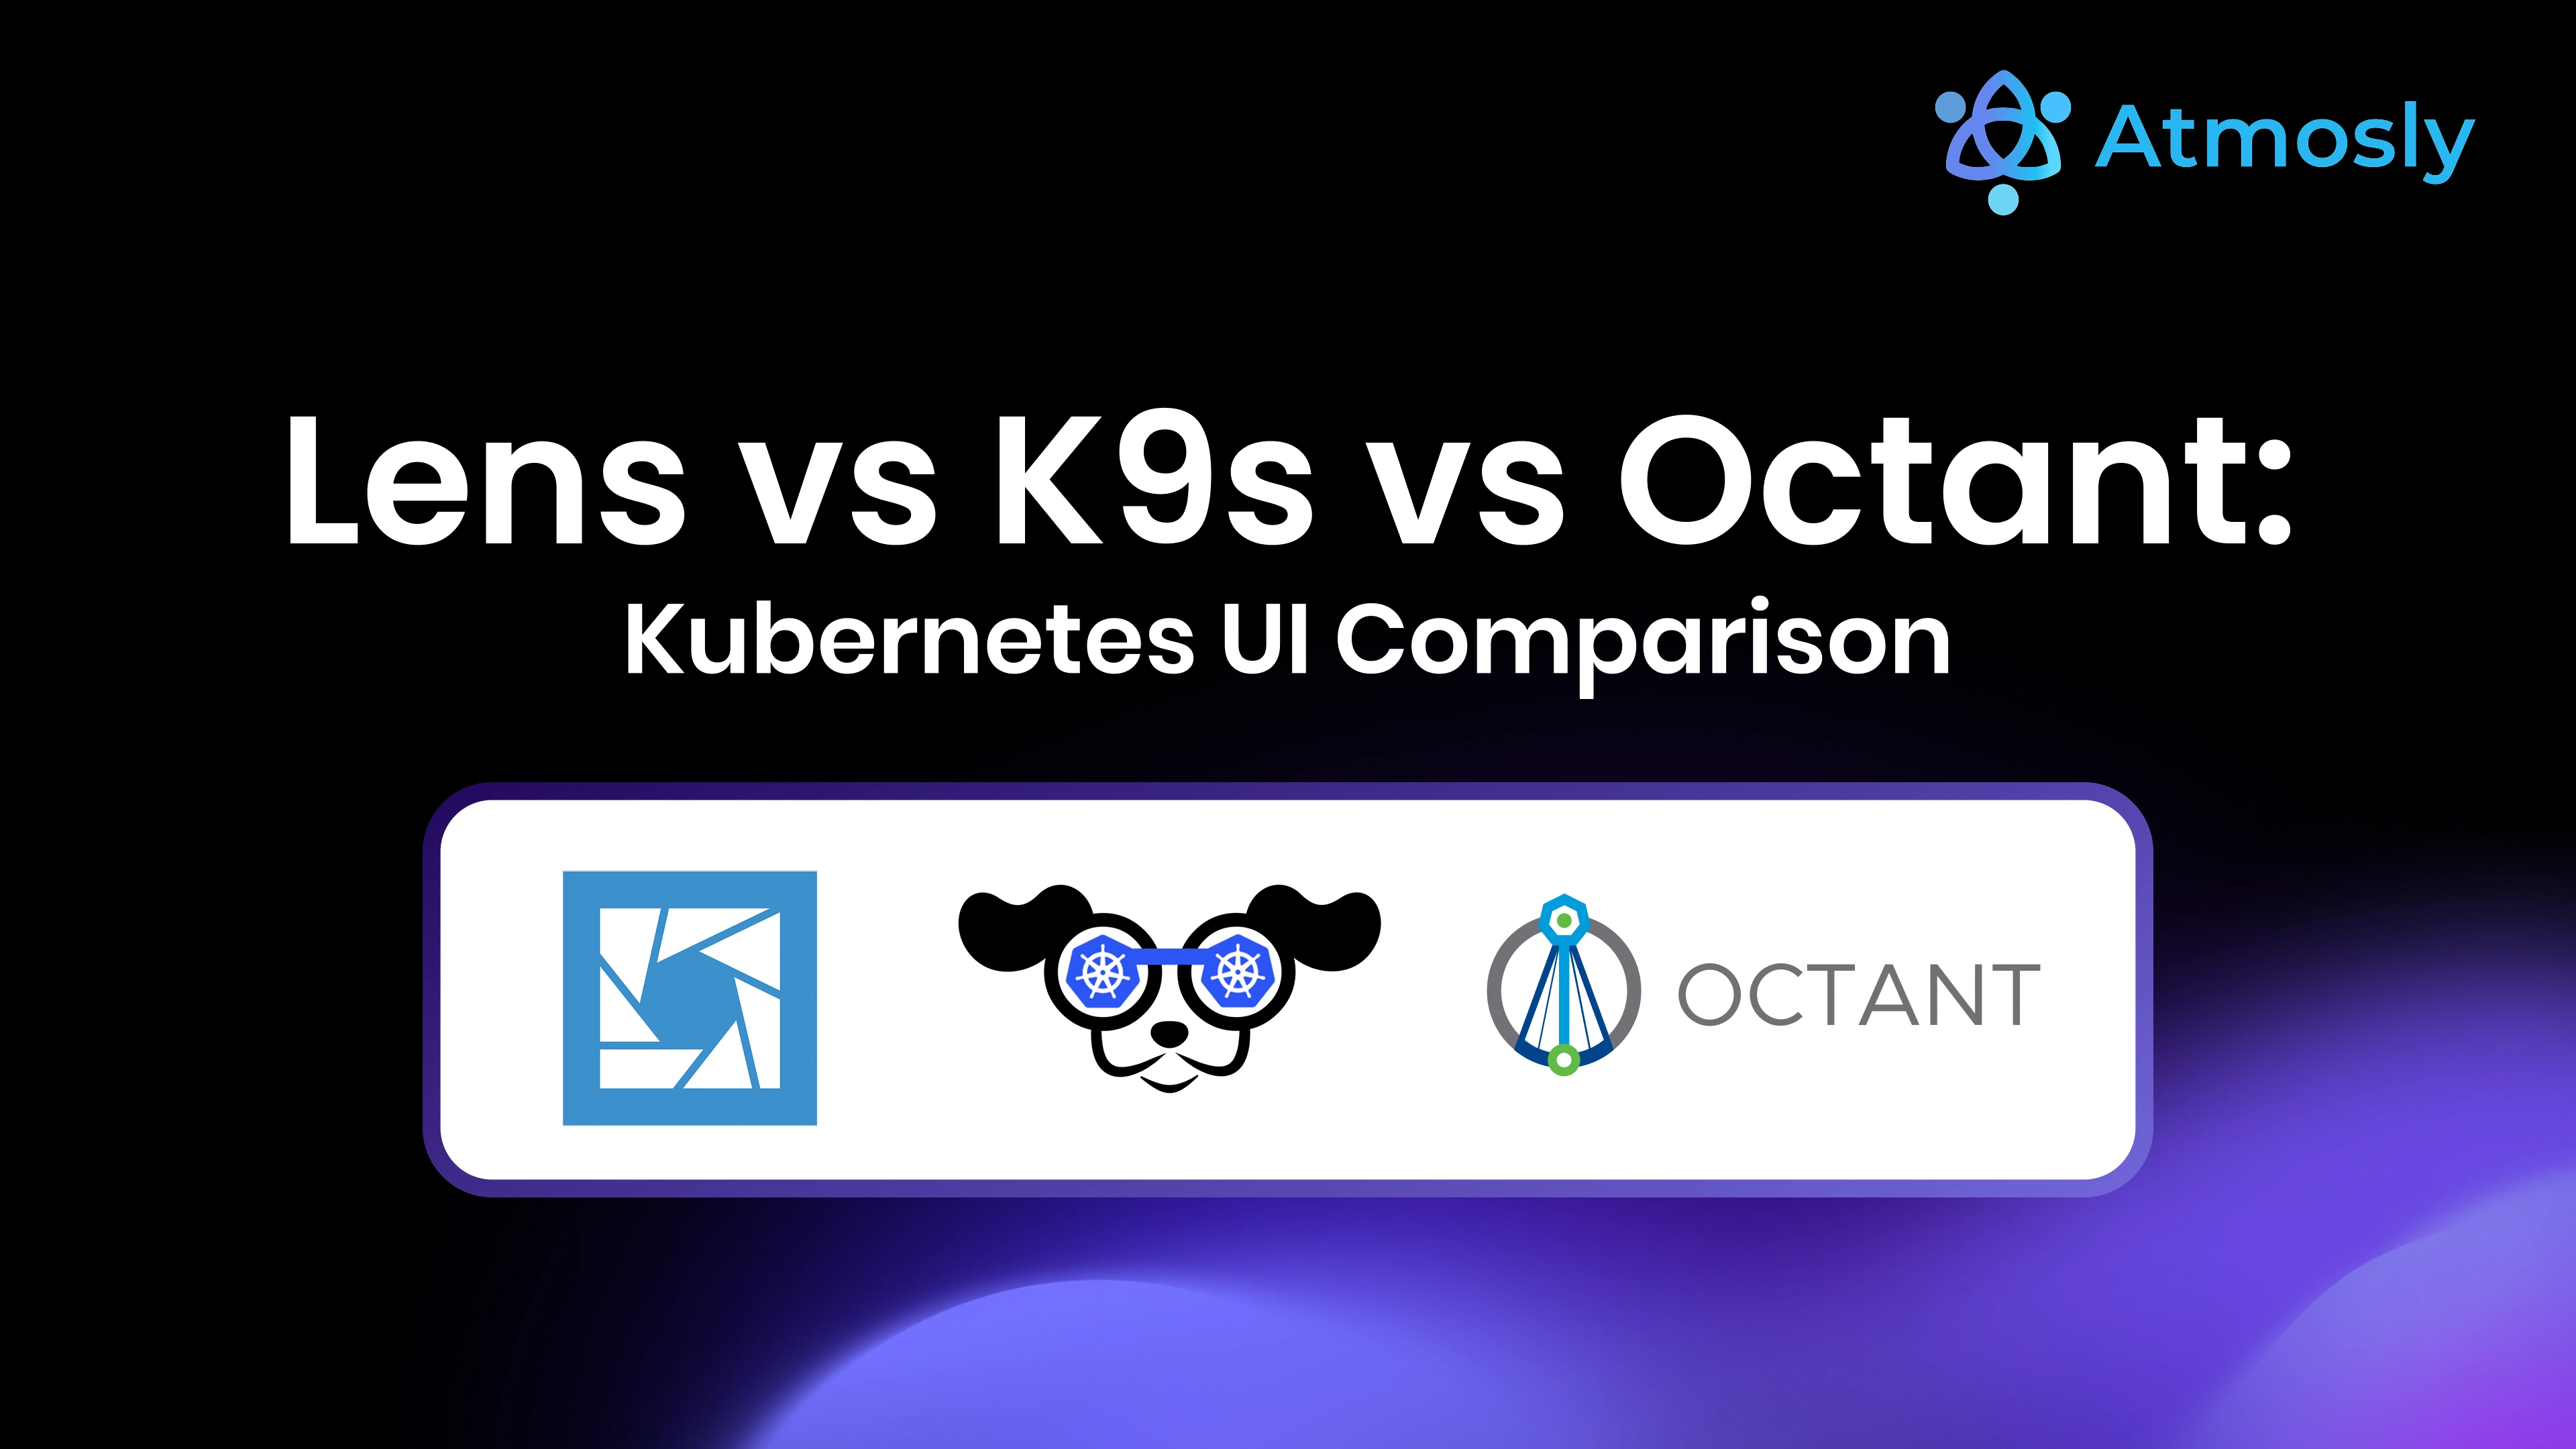
But which one is right for you? The market is crowded, but three names have historically dominated the conversation: Lens, K9s, and Octant. In this blog, we will dissect these tools, analyze their architectures, compare their workflows, and see how they stack up against modern AI-powered platforms like Atmosly.
The Evolution of Kubernetes Management
To understand why we need these tools, we must look at the evolution of Kubernetes management.
- Phase 1: The CLI Era (2015-2018).
kubectl get podswas everything. It was simple, scriptable, and universal. However, it lacked visibility. You couldn't "see" the relationship between a Service and an Ingress without running three different describe commands and mentally mapping the selectors. - Phase 2: The Dashboard Era (2018-2021). The official Kubernetes Dashboard provided a web UI, but it was cumbersome to secure (requiring proxying) and often lacked real-time responsiveness. Tools like Octant emerged to fill this gap with better visualization.
- Phase 3: The IDE Era (2021-Present). Tools like Lens treated Kubernetes clusters not just as infrastructure, but as a development environment. They added features like one-click Helm installs, integrated terminals, and multi-cluster context switching.
- Phase 4: The Intelligence Era (2026+). This is where we are now. Seeing the data isn't enough; we need to understand it. Tools are now expected to provide AI-driven root cause analysis, cost insights, and security context.
1. Lens: The "Kubernetes IDE"
Lens is arguably the most popular graphical interface for Kubernetes. Originally an open-source project, it was acquired by Mirantis and has since evolved into a robust desktop application built on Electron.
Architecture & Design
Lens runs as a standalone desktop application on Windows, macOS, and Linux. Unlike web-based dashboards that require installation inside the cluster, Lens runs outside the cluster, using your local kubeconfig file to authenticate. This means zero-setup access to any cluster you already have CLI access to.
Key Features
Multi-Cluster Management
Lens's sidebar allows you to pin multiple clusters (Development, Staging, Production) and switch between them instantly. It handles the context switching under the hood, so you never accidentally run a delete command on Production while thinking you are in Staging.
Built-in Prometheus Integration
If your cluster has Prometheus installed, Lens auto-detects it. Suddenly, your list of pods isn't just a text list; it's a live dashboard showing CPU, Memory, and Network graphs for every single container. This allows you to correlate a "CrashLoopBackOff" with a memory spike visually.
The "Smart" Terminal
Lens includes a built-in terminal pane. When you open it, Lens automatically sets the context to the cluster and namespace you are currently viewing. If you have Helm installed, it detects that too. This eliminates the friction of kubectx and kubens commands.
Extensions API
Lens supports extensions. Vendors (like Aqua Security, Carbon Black, etc.) have built plugins that add tabs to Lens. For example, you can see image vulnerability scan results right next to your Pod definition.
The Licensing Controversy
In late 2022/2023, Lens Desktop introduced a subscription model for commercial users (Lens Pro), which caused friction in the community. While a "Personal" version remains free for students and small businesses, large enterprises must pay. This led to the rise of OpenLens, the open-source core of Lens without the proprietary extensions and login requirements. If you are in a large enterprise, be aware of the compliance requirements for using Lens Desktop.
Pros & Cons
- ??? Pro: Incredible UX. It lowers the barrier to entry for junior developers significantly.
- ??? Pro: Visualizing CRDs (Custom Resource Definitions) is effortless. Lens auto-generates forms for any CRD it finds.
- ??? Con: Resource Heavy. As an Electron app, it can easily consume 2GB+ of RAM if you have multiple clusters open.
- ??? Con: The paywall for features like "Hardened Security" and "Team Sync" has pushed some users away.
2. K9s: The Terminal Warrior's Weapon
K9s is a terminal-based UI (TUI) written in Go. It effectively puts a "GUI" inside your terminal window. It is beloved by SysAdmins, SREs, and anyone who lives in VIM.
Architecture & Design
K9s is a single binary. It runs on your local machine (or a bastion host) and talks to the API server. Because it's text-based, it renders instantly, uses negligible RAM (often < 50MB), and works over SSH connections where graphical forwarding would be impossible.
Key Features
Keyboard-Driven Workflow
K9s is designed for speed. You don't click; you type.
:pod- Jump to Pods view:svc- Jump to Services view/nginx- Search/Filter for "nginx"ctrl-d- Delete resourcel- View logss- Shell into container
Once mastered, this muscle memory makes you significantly faster than a mouse user.
The "Pulse" Mode
Pressing :pulse gives you a high-level overview of the cluster's health???users, deployments, and event spikes???displayed in a retro ASCII-art dashboard.
XRay View
The :xray RESOURCE command is powerful. :xray deploy shows you a tree view of your Deployments -> ReplicaSets -> Pods, visually indicating which part of the chain is broken.
Benchmarking
K9s integrates with hey, a HTTP load generator. You can port-forward a service and trigger a load test directly from the K9s interface to see how your HPA (Horizontal Pod Autoscaler) reacts.
Pros & Cons
- ??? Pro: Blazing fast. No rendering lag, no loading spinners.
- ??? Pro: Runs everywhere. You can use it on a headless Linux server over SSH.
- ??? Pro: The "kill" functionality (ctrl-k) is satisfyingly quick for cleaning up stuck pods.
- ??? Con: steep learning curve. If you don't know the hotkeys, you will be staring at a blank screen.
- ??? Con: Limited visualization. You can't see complex line graphs or historical trends like you can in Lens.
3. Octant: The Extensible Web Dashboard (Legacy)
Octant was an open-source tool developed by VMware. It took a different approach: it ran a local web server on your machine (localhost:7777) and opened a browser window.
The "Resource Graph" Innovation
Octant's claim to fame was its "Resource Viewer." It visually mapped the relationships between objects. If you clicked on a Pod, it drew lines connecting it to the Service, the Ingress, the ServiceAccount, and the ConfigMaps it mounted. For understanding complex microservices architectures, this was invaluable.
The Extensibility Model
Octant was written in Go and exposed a plugin API that allowed backend developers to write Go code to extend the dashboard. This made it popular for platform teams who wanted to build custom views for their internal CRDs.
Status in 2025
Crucial Note: Octant was archived in late 2022. While it still works on many clusters, it is no longer actively maintained. It has largely been superseded by tools like Headlamp and Skooner, or simply by the improved extensibility of Lens. We include it here because many legacy platform engineering setups still rely on it, but new users should generally look elsewhere.
Comparison Scenario: Debugging a "CrashLoopBackOff"
To truly understand the difference, let's walk through a common scenario: A pod in production is crashing.
In Lens:
- You open Lens and see the "Workloads" tab has a red dot.
- You click "Pods" and sort by status. The crashing pod is highlighted in red.
- You click the pod row. A detailed pane slides out.
- You see a live graph of Memory usage spiking right before the crash.
- You click the "Logs" icon to open a streaming log window.
- You spot the error, fix the code, and click "Delete" on the pod to force a restart.
Time taken: 30 seconds. Experience: Visual, intuitive.
In K9s:
- You open your terminal and type
k9s. - You type
:podand then/crashto filter by status. - You navigate to the pod with arrow keys.
- You press
l(log) to see the output. You pressp(previous) to see why it crashed last time. - You press
esc, thenctrl-d(delete) to restart it.
Time taken: 10 seconds. Experience: Fast, requires memory of hotkeys.
The Missing Layer: Why UI is Not Enough
We have discussed tools that help you see and interact with the cluster. But in 2026, managing Kubernetes at scale requires more than just a dashboard. It requires Intelligence.
Lens and K9s will tell you that a pod is crashing. They will show you the logs. But they won't tell you:
- "Is this crash related to the deployment change my colleague made 10 minutes ago?"
- "Is this pod crashing because the node is out of IOPS?"
- "How much is this crash costing us in wasted compute?"
Enter Atmosly: The AI-Powered Control Plane
Atmosly represents the next generation of Kubernetes management. It doesn't compete with K9s or Lens; it wraps them in a layer of intelligence.
1. Automated Root Cause Analysis (RCA)
When a pod crashes in Atmosly, you don't just get a red status. Atmosly's AI agent scans the logs, correlates them with Kubernetes events, checks the node metrics, and looks at recent GitOps deployments. It then generates a plain-English report: "Pod 'frontend-x8s' crashed due to OOMKilled. Memory usage exceeded the 512Mi limit. This correlates with the recent deployment 'feat/image-processing' which increased heap usage."
2. Security & Guardrails
Lens allows you to edit YAML freely. This is dangerous. Atmosly acts as a guardrail. It scans your manifests against best practices (OPA policies) before they are applied, preventing misconfigurations that K9s or Lens would happily allow you to execute.
3. Cost Visibility
Neither Lens nor K9s has a concept of "money." Atmosly tracks the dollar cost of every namespace and workload. It can alert you: ???Your 'dev' namespace has increased in cost by 40% this week due to abandoned oversized pods.???
Conclusion & Recommendation
So, what should be in your toolbox in 2026?
For the Daily Driver:
- If you are a Platform Engineer or SysAdmin: Learn K9s. The speed is unbeatable, and it forces you to understand the underlying Kubernetes primitives. It is the "Vim" of Kubernetes.
- If you are an Application Developer: Use Lens (or OpenLens). The visual guidance helps you understand how your application runs without needing to become a Kubernetes expert.
For the Platform Strategy:
- You need Atmosly. A UI is for interaction; Atmosly is for observability and governance. Use K9s to delete a pod, but use Atmosly to understand why it needs deleting and to prevent it from breaking again.
The best engineers don't choose one; they use the right tool for the job. Keep K9s in your terminal for quick fixes, keep Lens on your desktop for exploration, and keep Atmosly in your browser for the peace of mind that your platform is healthy, secure, and cost-efficient. SignUp today for Atmosly.


