Every day, hundreds of CI/CD pipeline executions flow through Atmosly. Builds compile. Tests run. Security scanners sweep container images. Deployments roll across production clusters on EKS, GKE, and AKS. Across dozens of customer teams — fintech companies processing payments, healthcare platforms handling patient data, SaaS products serving millions of requests — our engine orchestrates it all. This is not the story of one team deploying frequently. This is the story of a platform-grade CI/CD engine that powers continuous delivery at scale for organizations that depend on it every hour of every working day.
We built Atmosly to be that engine. Not a pipeline template. Not a CI server you host yourself. A managed CI/CD platform that receives webhook events from hundreds of repositories, resolves pipeline definitions, schedules execution pods on Kubernetes, runs builds and tests and security scans in parallel, deploys with canary or blue-green or rolling strategies, verifies production health against SLO gates, and records every step for audit and replay. Hundreds of times a day. Every step fast, isolated, and observable.
This article pulls back the curtain on how we architected that engine. We will walk through the complete lifecycle of a pipeline execution on our platform, the four-layer architecture that makes it possible, the security pipeline we run on every build by default, the caching system that cuts build times by 70 percent, the deployment strategies our customers rely on to keep production stable, and the hard engineering problems we solved to handle scale — like what happens when 200 services all trigger builds at 9 AM on Monday morning.
At peak hours, our platform handles 40 or more concurrent pipeline runs, each with five to eight stages, spanning three major cloud providers. If you are a DevOps engineer, SRE, or platform engineering team evaluating how to build or adopt a CI/CD platform that can handle this kind of throughput, this is the inside story of how we did it and what it took to get here.
The Scale Problem We Solved
Before we built Atmosly, we spent years inside platform engineering teams that ran into the same wall. A team would set up Jenkins or GitHub Actions. It would work great for one service, maybe five. Then the organization grew. More teams onboarded. More services spun up. More clusters were provisioned. And suddenly, the CI/CD infrastructure that worked for a single team became a bottleneck for the entire engineering organization.
The problem is not configuring one pipeline. The problem is operating hundreds of pipelines across dozens of teams, multiple Kubernetes clusters, and three cloud providers — simultaneously, reliably, and securely. That is the difference between a single-team pipeline and a platform-grade CI/CD engine. A single-team pipeline handles ten builds a day. Our engine handles hundreds. A single-team pipeline runs on one cluster. Our engine deploys to EKS, GKE, and AKS clusters across regions. A single-team pipeline has one set of security policies. Our engine enforces different policies per environment, per customer, per compliance framework.
The numbers tell the story. On a typical weekday, our platform processes hundreds of pipeline executions. Each execution includes five to eight stages — build, unit tests, security scans, deployment, verification. During peak hours, 40 or more of these pipelines run concurrently, competing for compute resources, pulling from shared caches, writing to container registries, and deploying to production clusters. Monday mornings spike to nearly double the daily average as teams merge weekend PRs and kick off the week. Our engine handles all of this without dropping events, starving builds of resources, or degrading deployment reliability.
That is the scale problem we solved. Not how to make one team fast — how to make every team fast, simultaneously, on a shared platform that maintains isolation, security, and observability across every execution. The rest of this article explains how we built the engine that makes it possible.
What Happens When a Pipeline Triggers on Our Platform
To understand our architecture, start with what happens when a single pipeline triggers. This sequence executes hundreds of times daily on our platform, and every step must be fast, isolated, and observable.
A developer pushes a commit to GitHub. GitHub fires a webhook to our ingestion endpoint. Our ingestion layer receives the payload, authenticates it using the webhook secret, parses the event, and normalizes it into our internal trigger schema. The normalized event enters our deduplication window — if GitHub retried the same webhook or if multiple near-simultaneous pushes happened on the same branch, duplicates are dropped. The deduplicated event is matched against pipeline definitions configured for that repository and branch pattern.
Our orchestration layer takes over. It resolves the pipeline definition — which stages to run, in what order, with what parallelism, under what conditions. It builds a directed acyclic graph (DAG) representing the execution plan: build first, then fan out to tests, security scans, and analysis in parallel, then fan in to a deployment gate, then deploy, then verify. The orchestrator creates an execution record, assigns it a unique run ID, and transitions the pipeline state to PENDING.
Our execution engine picks up the pending run. For each stage, it generates a Kubernetes pod specification — the right container image for the language and toolchain, CPU and memory resource requests, volume mounts for caching and source code, secret references for credentials. Pods are scheduled onto our build cluster. The build stage compiles code, builds a Docker image using BuildKit with registry-backed caching, and pushes the image to the container registry. Parallel stages — unit tests, Trivy container scanning, SonarQube SAST analysis, secret detection — spin up simultaneously, each in its own isolated pod, each consuming the build artifact by SHA-256 digest.
When all parallel stages complete and pass their gates, the deployment layer takes over. It resolves the target cluster and namespace, selects the deployment strategy (rolling, blue-green, or canary based on the pipeline configuration), and initiates the rollout. For a canary deployment, our engine ramps traffic from 5 percent to 25 percent to 50 percent to 100 percent, checking SLO metrics — P99 latency, error rate, memory usage — at each step. If any metric breaches its threshold, our engine automatically rolls back to the previous version in under 30 seconds.
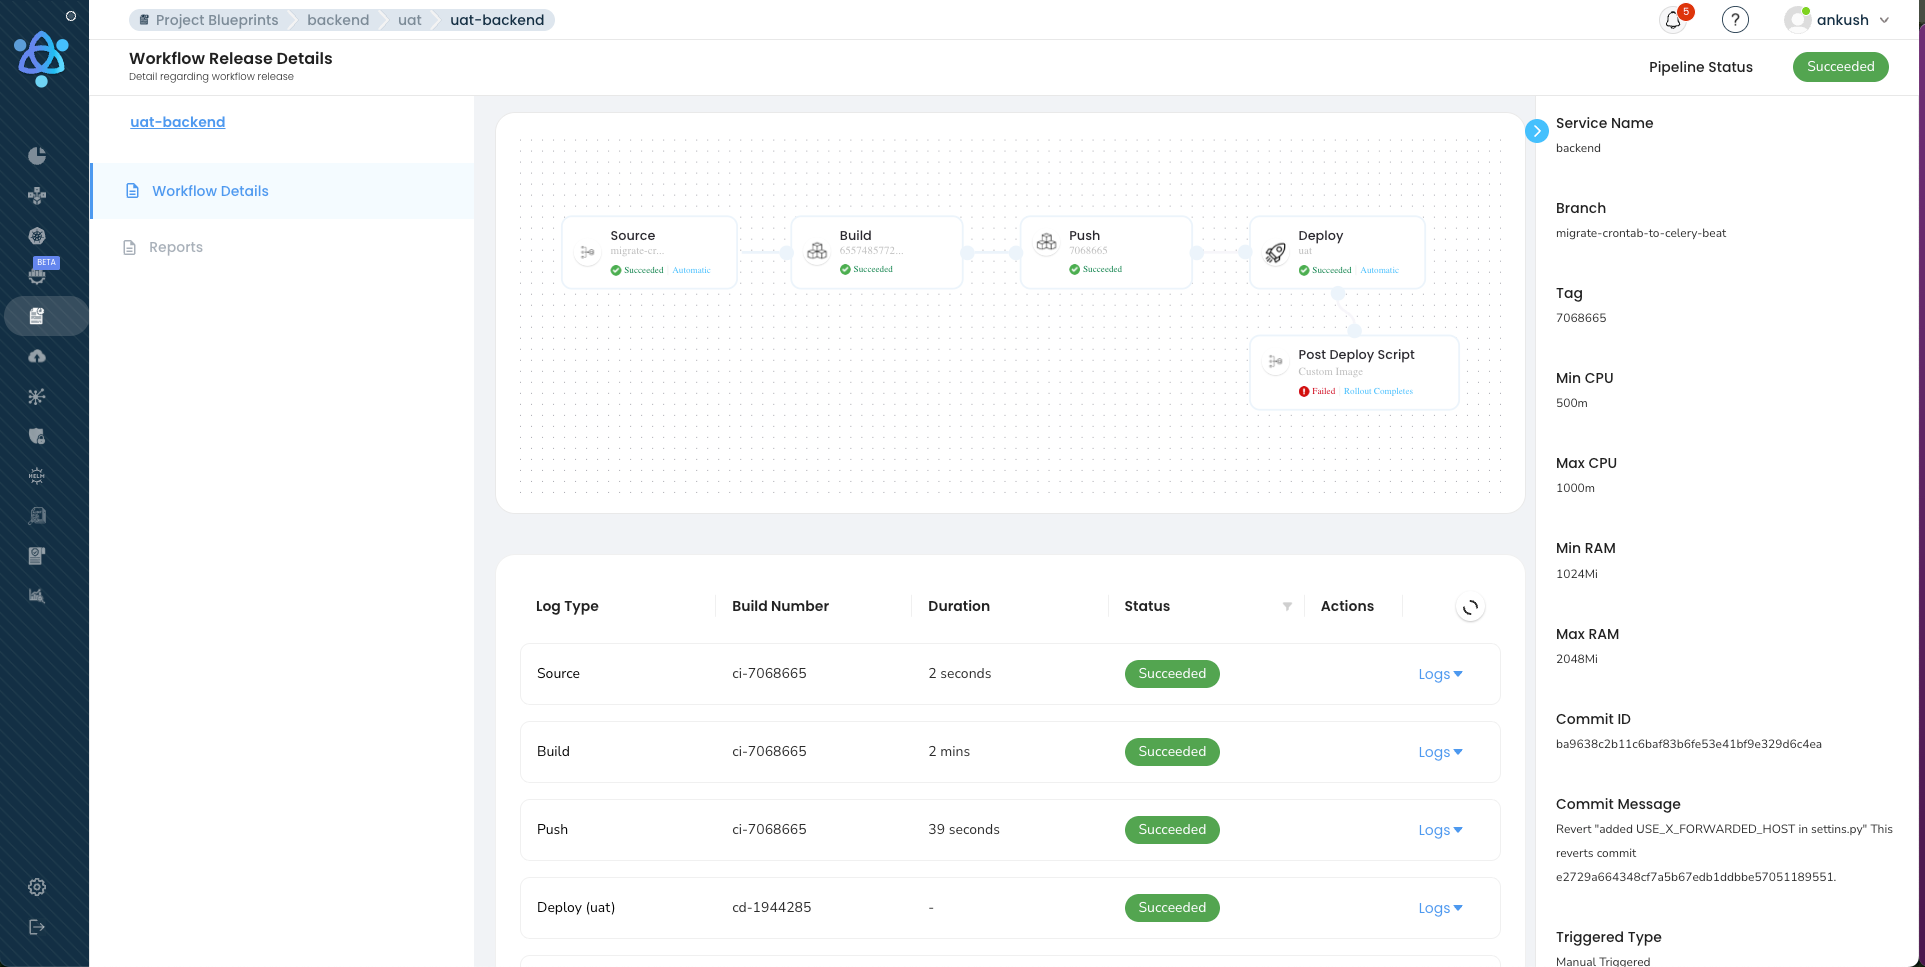
Post-deployment verification runs: readiness probe checks, smoke tests against critical endpoints, a 10-minute SLO observation window. Only when everything passes does the pipeline transition to SUCCEEDED. The entire sequence — from git push to verified production deployment — typically completes in under 10 minutes. And it happens hundreds of times a day across our customer base.
Our Four-Layer Architecture
Our CI/CD engine is not a monolith. We designed it as four distinct layers, each with clear responsibilities, well-defined interfaces, and independent scaling characteristics. This layered approach ensures that a bottleneck in one area — a surge in webhook events, a spike in build resource demand, a slow container registry — does not cascade into failures across the platform. Each layer is platform infrastructure that serves every customer simultaneously.
Layer 1: Event Ingestion
Every pipeline on our platform begins with an event. A developer pushes a commit. A pull request is merged. A tag is created. A scheduled trigger fires. Our event ingestion layer is responsible for receiving these signals from every customer's repositories across multiple Git providers, normalizing them into a common format, deduplicating them, and routing them to the correct pipeline definition.
We receive webhooks from GitHub, GitLab, and Bitbucket — each with different payload formats, different authentication mechanisms, and different retry behaviors. Our ingestion layer normalizes all of these into a unified internal trigger schema. A push event from GitHub and a push event from GitLab produce identical internal events. This normalization means our orchestration layer does not need to understand provider-specific details — it works with a clean, standardized event regardless of source.
Event deduplication is critical at the volume we handle. GitHub may retry a webhook delivery if it does not receive a 200 response quickly enough. When a team merges five PRs in two minutes, we should not run five identical pipelines against the same branch state. Our ingestion layer maintains a short-lived deduplication window keyed on a hash of the event source, repository, commit SHA, and event type. Duplicate events are acknowledged to the provider (so they stop retrying) but not forwarded to the orchestrator.
We also built auto-detection of application stacks into this layer. When a customer first connects a repository to Atmosly, our platform inspects the codebase — scanning for Dockerfiles, language-specific manifest files (package.json, go.mod, pom.xml, requirements.txt), Helm charts, Kubernetes manifests, and Terraform files. Based on this inspection, we automatically generate a pipeline template with appropriate build steps, test commands, and deployment configurations for the detected stack. A team can go from repository connected to first green build in under two minutes, without writing a single line of pipeline configuration.
At scale, our ingestion layer handles burst traffic without dropping events. The Monday 9 AM spike — when dozens of teams across our customer base simultaneously push code that accumulated over the weekend — can produce a surge of webhook events that is three to four times the steady-state rate. Our ingestion layer absorbs this burst by buffering events in a durable message queue and processing them at a rate the downstream orchestrator can handle, without losing any event and without making webhook senders wait.
Layer 2: Pipeline Orchestration
Once an event is ingested and matched to a pipeline definition, our orchestration layer takes over. This is the brain of our engine — it resolves pipeline definitions into execution plans, manages the state machine for every in-flight pipeline run, and coordinates the fan-out and fan-in of parallel stages across hundreds of concurrent executions.
Our orchestrator builds a DAG from each pipeline definition. It resolves which stages can run in parallel (tests, security scans, and analysis all depend only on the build artifact, not on each other), which stages must wait for predecessors to complete (deployment waits for all verification stages to pass), and how failures propagate (a failed security scan blocks deployment even if tests passed). This DAG-based execution model is what enables the parallelism that keeps our pipeline times under 10 minutes even with comprehensive verification. Without it, running stages sequentially would push pipeline times to 20 or more minutes — making hundreds of daily pipeline executions impractical within working hours.
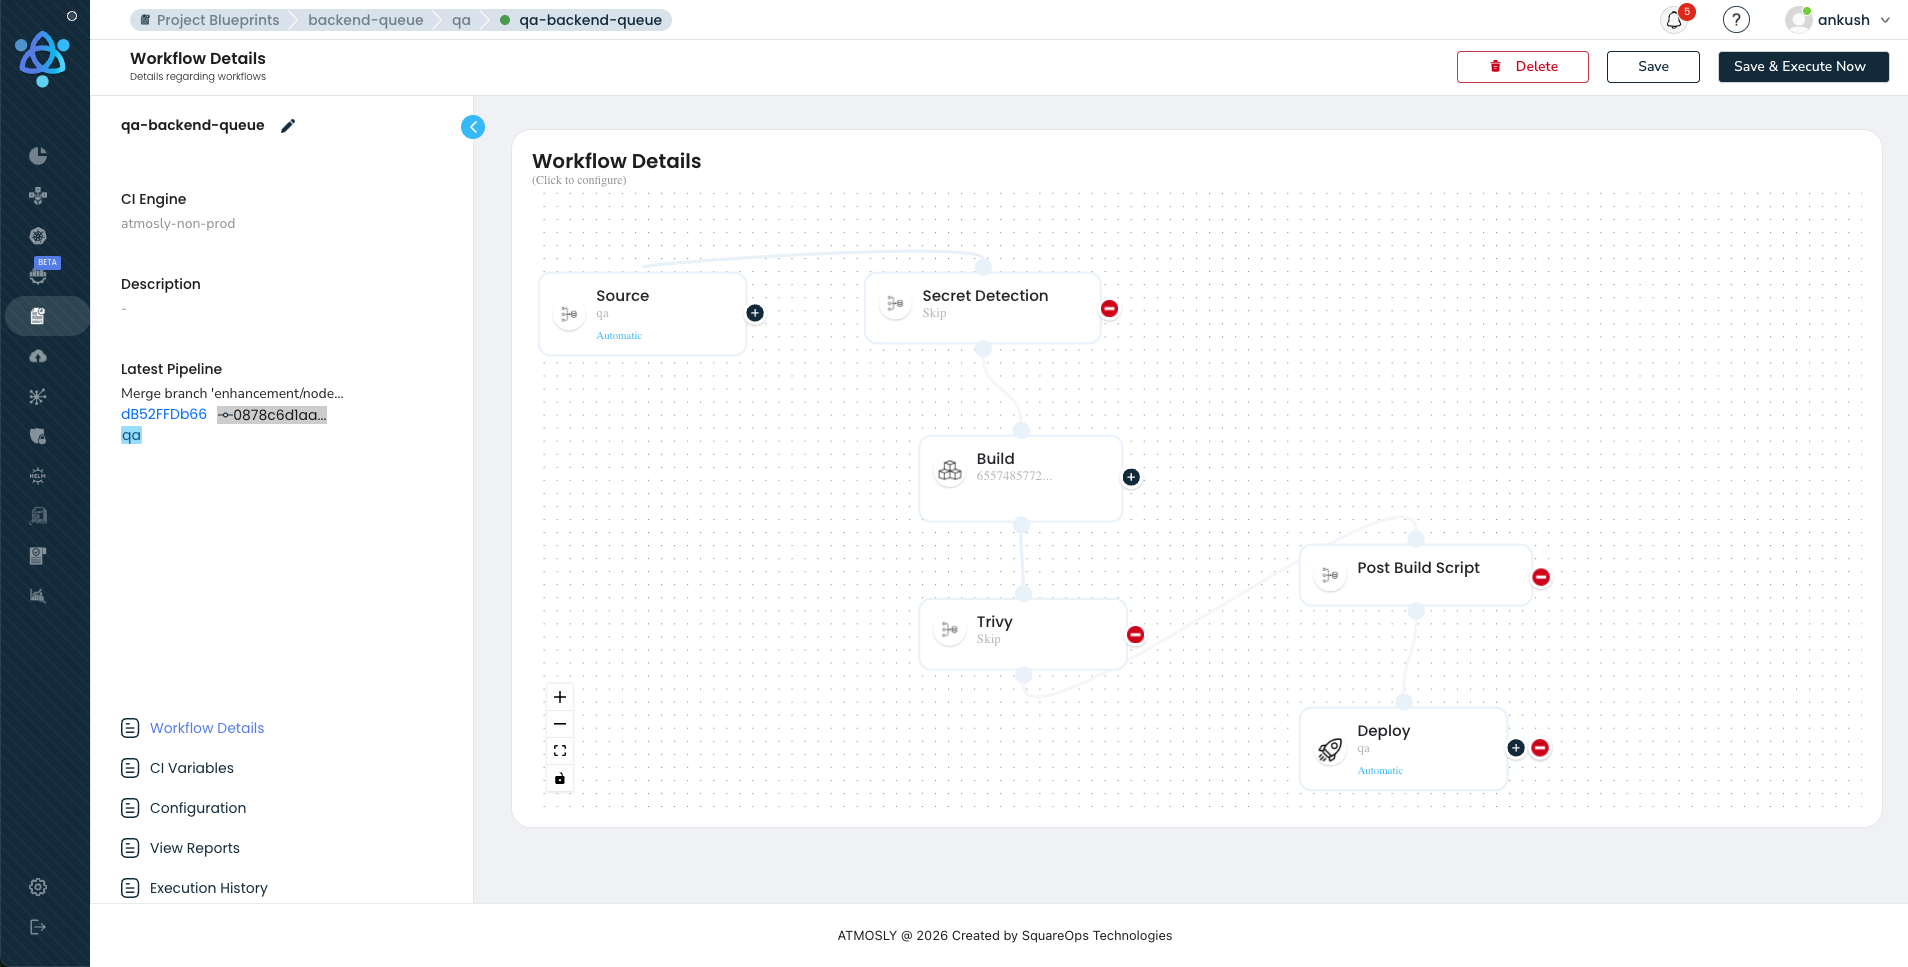
Our visual pipeline builder provides a drag-and-drop interface for constructing these DAGs. Customers design pipelines by dragging stages into parallel lanes, configuring parameters for each stage, and defining conditional edges. No YAML. The visual representation compiles to the same DAG specification that powers the execution engine
The state machine is critical at our scale. Each pipeline run transitions through states: PENDING, BUILDING, TESTING, DEPLOYING, VERIFYING, SUCCEEDED, FAILED, ROLLED_BACK. With hundreds of concurrent runs, state transitions must be atomic — two stages completing simultaneously for the same pipeline must not corrupt the run state. We use event-sourced state tracking: every transition is recorded as an immutable event in an append-only log. The current state of any pipeline is derived by replaying its events. This provides a complete audit trail, the ability to rebuild state after a crash (replay from the last snapshot), and temporal queries for analytics. If an orchestrator pod crashes mid-pipeline, the replacement pod reconstructs the exact state of every in-flight run from the event log. No customer pipeline is ever lost or left in an indeterminate state.
Layer 3: Execution Engine
Our execution engine is where code compiles, tests run, images build, and security scanners sweep. At hundreds of pipeline executions per day across many customer environments, this layer must be fast, isolated, and efficient with resources.
Ephemeral Pod Execution
Every stage runs in an isolated, ephemeral Kubernetes pod. When the orchestrator schedules a build stage, our execution engine creates a pod spec with the appropriate container image (for example, golang:1.22 for a Go service, node:20-alpine for a Node.js app), resource requests and limits, volume mounts for caching and source code, and environment variables for configuration. The pod runs, executes the stage, reports results back to the orchestrator via gRPC, and terminates. There is no persistent build agent. No mutable state. No class of bugs where something works on one agent but not another.
Resource isolation is enforced at the Kubernetes level. Each customer's pipelines get guaranteed CPU and memory via pod resource quotas. A runaway build in one customer's service cannot starve another customer's builds of resources. Pod security standards prevent privilege escalation, host path mounts, and other common attack vectors. In our multi-tenant architecture, customer workloads never share execution pods — each pipeline stage runs in its own isolated pod with its own resource allocation, network namespace, and filesystem. This pattern is central to how we handle Kubernetes CI/CD at scale.
Our Three-Layer Caching Architecture
When we designed our caching layer, we identified three distinct caching opportunities that compound to deliver a 70 percent reduction in build times. This caching architecture is one of the most impactful pieces of engineering in our entire platform, and we will cover it in depth in a dedicated section below. The summary: registry-backed Docker layer caching, lockfile-keyed dependency caching, and build artifact sharing across stages. The result: builds that took 15 minutes drop to 4 minutes. Across hundreds of daily pipeline runs, that saves days of cumulative compute time.
Log Streaming and Secret Injection
Build logs are streamed in real time via WebSocket connections from execution pods to the Atmosly UI. Developers see build output, compilation errors, test failures, and scan results as they happen — not after the stage completes. Log lines are indexed by pipeline run ID, stage ID, and timestamp, enabling full-text search across historical builds.
Secrets are injected into execution pods at runtime from external secret stores — HashiCorp Vault, AWS Secrets Manager, or GCP Secret Manager. Secrets are never written to disk, never logged, and never included in build artifacts. Our execution engine uses short-lived credentials (Vault dynamic secrets, AWS STS tokens) that expire after the pipeline run completes. This approach aligns with the zero-trust principles we outlined in our guide on Kubernetes secrets management.
Layer 4: Deployment and Verification
The deployment layer is where built, tested, scanned, and approved artifacts reach production. At hundreds of daily pipeline executions, safety means having multiple deployment strategies available and selecting the right one for each change. Our customers use three deployment strategies on our platform, each with distinct characteristics designed for different risk profiles.
Rolling Updates
Rolling updates are the default deployment strategy on our platform and the workhorse for approximately 80 percent of customer deployments. The Kubernetes Deployment controller gradually replaces old pods with new pods, maintaining a minimum number of available replicas throughout the rollout. Our defaults are tuned for safety: maxSurge at 25 percent (a 12-pod deployment can temporarily run 15 pods), maxUnavailable at 0 (no capacity lost during transition), and readiness probes that must pass before the controller considers a new pod healthy.
Our engine watches the rollout in real time using the Kubernetes watch API. If a new pod fails its readiness probe after the configured timeout (default: 120 seconds), the rollout is automatically paused. Our platform sends an alert, and the team can investigate or trigger an immediate rollback. Rollback is a single action that reverts the Deployment to its previous ReplicaSet — pods are replaced with the known-good version in under 60 seconds.
Blue-Green Deployments
We built blue-green deployment support for customers who need instant traffic switches with zero ambiguity. Blue-green runs two complete copies of the application simultaneously. The blue environment serves live traffic while the green environment receives the new version. Once the green environment passes health checks and smoke tests, a Kubernetes Service selector switch redirects all traffic from blue to green instantaneously — no gradual ramp, no percentage-based routing.
Our implementation uses parallel ReplicaSets behind a Kubernetes Service. The green ReplicaSet is created with the new version. While both are running, our platform executes automated smoke tests against the green ReplicaSet directly. If smoke tests pass, the production Service selector is updated. Traffic switches immediately. Our platform maintains the blue environment as a warm standby for 30 minutes after the switch. If monitoring detects issues during this window, a one-click rollback switches the Service selector back to blue. After 30 minutes with no issues, the blue ReplicaSet is scaled to zero. The tradeoff is resource cost — double the pods for 30 minutes — which is why we recommend blue-green for critical services and database schema migrations rather than as the default for all deployments.
Canary Deployments
Canary deployments are the most sophisticated strategy we support and the one we recommend for high-frequency deployment of user-facing services. Instead of switching all traffic at once, our canary implementation gradually shifts traffic from the old version to the new version while monitoring SLO metrics at each step. A typical canary progression on our platform:
- 5 percent traffic to canary — 5-minute observation window. Our platform checks P99 latency, error rate, and resource utilization.
- 25 percent traffic to canary — 5-minute observation window. Same SLO checks plus business metrics where configured.
- 50 percent traffic to canary — 5-minute observation window. Full SLO validation.
- 100 percent traffic to canary — Promotion complete. Old ReplicaSet scaled down.
At each step, our platform evaluates configurable SLO gates. Typical thresholds: P99 latency must not increase by more than 10 percent compared to baseline, error rate must remain below 0.1 percent, pod restart count must be zero, memory usage must not exceed 90 percent of the resource limit. If any gate fails, our engine automatically rolls back — traffic shifts to 0 percent canary, the canary ReplicaSet is terminated, and the team receives a detailed analysis of which metric tripped the gate. The entire rollback completes in under 30 seconds because the old pods are still running and healthy. Traffic splitting is implemented at the service mesh layer (Istio VirtualService, Linkerd TrafficSplit) or via ingress controller weights — our platform abstracts these implementation details so engineers configure canary percentages and SLO gates in our visual builder without touching Kubernetes resources directly.
Post-Deployment Verification
Regardless of which deployment strategy a customer chooses, every production deployment on our platform triggers a post-deployment verification sequence. This runs automatically after every deployment and includes readiness probe validation (all pods healthy), smoke test execution against critical endpoints, SLO gate evaluation over a 10-minute window (P99 latency, error rate, throughput compared to pre-deploy baseline), and deployment history recording (the exact image digest, config hash, deploy timestamp, and deploying user are stored for audit). The deployment is not considered complete until all post-deploy checks pass. If they fail, our platform initiates automatic rollback and notifies the on-call engineer with context — which metric failed, by how much, and a link to the relevant dashboard. Every previous deployment version is stored, and one-click rollback to any historical version is always available.
Our Security Pipeline: DevSecOps Built Into the Platform
Security scanning on our platform is not optional and it is not something customers have to configure from scratch. It runs on every pipeline by default. When your organization processes hundreds of pipeline executions daily, manual security review is impossible — every scan that a human could run must run automatically, every policy that a human could enforce must be codified as a gate, and the entire security pipeline must add zero time to the critical path. We built our security pipeline around that principle, extending the core idea of DevOps automation fully into security.
Here is the security toolchain we integrated into our platform and when each tool runs:
| Tool | Category | What It Catches | When It Runs | Gate Policy |
|---|---|---|---|---|
| detect-secrets | Secret Detection | API keys, tokens, passwords, private keys committed to source code | Pre-build (on source checkout) | Hard fail — any detected secret blocks the pipeline |
| Trivy | Container Scanning | OS-level CVEs, library vulnerabilities in the built Docker image | Post-build (parallel with tests) | Configurable — block on CRITICAL/HIGH, warn on MEDIUM |
| SonarQube | SAST / Code Quality | SQL injection, XSS, code smells, duplication, coverage gaps | Post-build (parallel with tests) | Quality gate — must pass configured threshold |
| OPA (Open Policy Agent) | Policy Enforcement | Kubernetes manifest violations (privileged containers, missing resource limits, disallowed registries) | Pre-deploy (on generated manifests) | Hard fail — policy violations block deployment |
| Syft + Grype | SBOM + SCA | Software Bill of Materials generation, license compliance, known-vulnerable dependencies | Post-build (parallel with tests) | Configurable — block on critical vulns, flag license concerns |
The critical architectural decision we made is that all security scans run in parallel with unit tests, not sequentially after them. After the build stage completes, our execution engine fans out to four or five parallel stages. Unit tests, Trivy scanning, SAST analysis, and secret detection all start simultaneously. The slowest of these stages determines the wall-clock time for the verification phase — typically 2-3 minutes. If these stages ran sequentially, verification would take 7-8 minutes, nearly doubling pipeline time. Across hundreds of daily pipeline executions, that difference adds up to hours of developer wait time.
We enforce per-environment policy configuration on our platform. In development, Trivy might warn on HIGH vulnerabilities but not block the pipeline. In staging, it blocks on HIGH and above. In production, it blocks on MEDIUM and above. This graduated strictness lets developers iterate quickly in dev while ensuring production deployments meet the strictest security bar. The policies are versioned alongside pipeline definitions, auditable, and reviewable.
Real-world impact from our customer base: one healthcare customer blocked 18 critical vulnerabilities in a single quarter that would have reached production under their previous manual review process. Their mean time to remediate dropped from 14 days (when vulnerabilities were found in production) to 2 hours (when vulnerabilities are caught pre-merge). A fintech team cut incident response time related to security issues by 60 percent because the attack surface — vulnerable code in production — shrank dramatically. These are the kinds of outcomes we see across our customer base, consistent with the broader shift toward integrated DevOps automation tools that treat security as a first-class pipeline citizen.
Enterprise features extend the security pipeline further. SBOM signing provides tamper-evident software bills of materials for supply chain compliance. Kubescape runtime security validates cluster configurations against NSA/CISA hardening guidelines. Our platform maintains 12-month audit trails for every security scan result, policy decision, and deployment approval — meeting the retention requirements of SOC 2, HIPAA, and PCI-DSS compliance frameworks.
How We Handle Scale: The Hard Engineering Problems
Running hundreds of pipeline executions daily across a multi-tenant platform introduces engineering challenges that do not exist in single-team CI/CD setups. We solved these through careful resource management, queue prioritization, tenant isolation, and battle-tested state management. These are patterns that align with the broader discipline of CI/CD pipeline best practices at Kubernetes scale.
The Monday 9 AM Problem
Most engineering teams start their workweek at roughly the same time. At 9 AM on Monday, developers across our customer base push code that was reviewed over the weekend, merge backed-up PRs, and kick off pipeline runs simultaneously. A build cluster that comfortably handles 15 concurrent builds during steady state is suddenly asked to run 40 or more. Without proper resource management, builds queue for 20-30 minutes, developers context-switch to other tasks, and the morning's velocity is lost across every team on the platform.
We built several complementary strategies into our platform to handle this. Build pod resource quotas set per-team maximums on concurrent build pods, preventing a single team from monopolizing the build cluster. A frontend team might get 4 concurrent build slots while a backend platform team gets 8, proportional to their service count and deployment frequency. Queue prioritization assigns priority levels to pipelines based on configurable rules. Production hotfixes get highest priority and preempt queued feature branch builds. Main branch builds get medium priority. Feature branch builds get lowest priority. A production hotfix will never wait behind a feature branch build. Execution pools maintain separate node pools for different workload classes — Growth customers get dedicated pools, Enterprise customers get custom pool sizes and regional distribution. This prevents a single heavy build (compilation-intensive, requiring large memory) from blocking a dozen fast builds by consuming all available resources on a shared pool.
Tenant Isolation
In our multi-tenant architecture, customer workloads never share execution pods. Every pipeline stage runs in its own isolated pod with its own CPU and memory allocation, its own network namespace, and its own filesystem. Kubernetes NetworkPolicies prevent cross-tenant network traffic within the build cluster. Resource quotas are enforced at the namespace level, so one customer's builds cannot consume resources allocated to another customer. Pod security standards prevent privilege escalation and host path mounts. This isolation model ensures that a misconfigured or malicious build in one customer's pipeline cannot observe, interfere with, or degrade another customer's pipeline execution.
State Management with Event Sourcing
At hundreds of pipeline executions per day, the state management layer must be both performant and recoverable. We use event sourcing: every state transition — stage started, stage completed, approval requested, deployment initiated, rollback triggered — is recorded as an immutable event in an append-only log. The current state of any pipeline is derived by replaying its events. This architecture provides a complete audit trail of every pipeline run (who triggered it, what ran, what passed, what failed, who approved, what deployed), the ability to rebuild state after a crash (replay events from the last snapshot), and temporal queries for analytics (how long did builds take on average last week? which stages fail most often?). State transitions are atomic — two stages completing simultaneously for the same pipeline cannot corrupt the run state — which is essential when our orchestrator is managing hundreds of concurrent pipeline runs.
Control Plane Observability
We monitor our own CI/CD engine with the same rigor we expect our customers to monitor their production applications. If our platform goes down, no code ships for any customer — the blast radius of a platform-level incident is enormous. We track our own ingestion latency, orchestrator throughput, pod scheduling time, cache hit rates, and deployment success rates. We alert on anomalies in any of these metrics. We run chaos engineering experiments against our own control plane — killing orchestrator pods mid-pipeline, simulating registry outages, inducing network partitions between our control plane and customer clusters — to verify that our recovery mechanisms work under realistic failure conditions.
Smart Caching: Why Our Pipelines Run 3x Faster
Our three-layer caching architecture is the single most impactful optimization in our execution engine. The math is straightforward: if each build takes 15 minutes without caching and 4 minutes with caching, you save 11 minutes per build. Across hundreds of daily pipeline executions, that is tens of hours of saved compute time every day. More importantly, 15-minute builds make hundreds of daily executions impractical (the build cluster would need to be enormous), while 4-minute builds make it routine on reasonable infrastructure.
Layer One: Registry-Backed Docker Layer Caching
Docker images are built as a stack of layers. A well-structured Dockerfile puts rarely-changing layers (base image, system packages) at the top and frequently-changing layers (application code) at the bottom. When a layer and all layers above it are unchanged, Docker reuses the cached version instead of rebuilding.
The question we had to answer was where that cache should live. Node-local caching stores layers on the build node's filesystem. This works on a single-machine CI server, but it breaks on multi-node Kubernetes clusters. If a customer has a 10-node build cluster and builds are distributed by the Kubernetes scheduler, any given build has only a 10 percent chance of landing on the same node as its predecessor. Nine times out of ten, you get a cold cache. Performance is unpredictable and averages closer to uncached than cached.
Registry-backed caching, which is what we implemented, stores layers in the container registry (ECR, GCR, Docker Hub, Harbor). Every build pushes its layers to a cache repository. Every subsequent build pulls cached layers from that repository before building. Because the registry is shared across all nodes, cache hit rates approach 100 percent for unchanged layers regardless of which node the build lands on. The tradeoff is network transfer time — pulling cache from a registry is slower than reading from local disk. But in practice, the pull takes 5-10 seconds for layer metadata and small diff layers, while a full rebuild of a cached layer might take 2-3 minutes. The net savings are enormous.
Our platform configures this automatically using BuildKit with inline cache metadata:
docker buildx build \
  --cache-from type=registry,ref=registry.example.com/cache/payment-service:buildcache \
  --cache-to type=registry,ref=registry.example.com/cache/payment-service:buildcache,mode=max \
  --tag registry.example.com/payment-service:${GIT_SHA} \
  --push .
The mode=max parameter stores all layers including intermediate layers from multi-stage builds, maximizing cache reuse even when the final image structure changes.
Layer Two: Lockfile-Keyed Dependency Caching
Our dependency caching layer is orthogonal to Docker layer caching and targets the package installation step specifically. The cache key is the hash of the lockfile — package-lock.json for Node.js, go.sum for Go, poetry.lock for Python, pom.xml or build.gradle.kts for Java. When the lockfile has not changed, the entire dependency directory (node_modules, vendor, .venv) is restored from our object storage layer in seconds. When the lockfile changes, we fall back to a full install but then update the cache for subsequent builds.
For a Node.js project with 800MB of node_modules — common for enterprise React applications — our dependency caching reduces the install step from 4-5 minutes to 8-12 seconds. For Go projects, vendor directory restoration takes under 5 seconds compared to 2-3 minutes for a full go mod download. Across hundreds of daily pipeline runs, this adds up to hours of saved time on dependency installation alone.
Layer Three: Build Artifact Sharing
Our platform allows downstream stages to consume outputs from upstream stages without rebuilding. The build stage produces a Docker image and pushes it to the registry. The test stage, the Trivy scan stage, and the deployment stage all reference that same image by its SHA-256 digest. No stage rebuilds what a previous stage already produced. Intermediate artifacts — compiled binaries, test coverage reports, SBOM documents — are stored in a shared workspace volume that persists for the duration of the pipeline run and is accessible to all stages within that run.
The Compound Impact
Combined, our three caching layers transform the build-test-scan pipeline from a 15-minute sequential process into a 4-minute parallel sprint. At our scale, this means: a typical Node.js build drops from 14 minutes to 3.5 minutes. A Go microservice drops from 10 minutes to 3 minutes. A Java service drops from 18 minutes to 5 minutes. We track cache hit rates across all customer pipelines — Docker layer cache hits average 92 percent, dependency cache hits average 87 percent, and we continuously optimize these rates by analyzing cache miss patterns and adjusting cache key strategies. The compute cost savings are substantial: 11 minutes saved per pipeline times hundreds of daily runs times the per-minute cost of build pod resources. For our larger customers, this translates to thousands of dollars in monthly savings on build infrastructure alone.
Our Approval System: Fast Without Being Reckless
Approval gates are necessary for compliance, security, and organizational confidence. But a poorly designed approval system becomes the single biggest bottleneck to deployment velocity. We designed our approval system to maintain governance rigor while eliminating unnecessary waiting. Here is how we structured approvals on our platform.
Environment-Specific Policies
Development: Fully automated, no approvals. Every push to a feature branch triggers a build, test, and deploy to the dev environment with no human intervention. The feedback loop is under 5 minutes. If a developer breaks something in dev, they fix it in the next push.
Staging: Auto-approved with guardrails. Merges to the main branch automatically deploy to staging if all quality gates pass (tests, security scans, code coverage). If any gate fails, the deploy is blocked automatically — no human needed.
Production: Configurable per team, scoped to risk level. Some teams auto-approve all changes that pass staging validation. Others require explicit approval from a tech lead or SRE. The approach we recommend, and the one most of our high-performing customers use, is risk-based approval.
Risk-Based Approval Scoping
Not every change carries the same risk. A one-line copy fix should not require the same approval process as a database schema migration. We designed our approval system to scope the process to the actual risk of the change:
- Auto-approve: Feature flag toggles, copy and localization changes, CSS and styling updates, non-breaking API additions, dependency patch updates.
- Single approver: New API endpoints, business logic changes, dependency minor or major updates, configuration changes affecting production behavior.
- Multi-approver: Database schema migrations, infrastructure changes, security-sensitive code (auth, payments, PII handling), breaking API changes.
Our pipeline determines risk level by analyzing the changeset: which files changed, whether migration files are present, whether the change touches security-critical paths, and the blast radius (number of dependent services). This analysis feeds into our approval routing logic, and the appropriate approval gate is inserted into the pipeline dynamically.
Contextual Approval UI
When a human does need to approve, our approval interface provides full context so they can decide in 30 seconds — not 30 minutes. The approver sees a contextual diff (what changed, with syntax highlighting), the full pipeline run status (build time, test results, all security scan results), deployment impact (which clusters, namespaces, and pods will be affected), the rollback plan (link to the previous deployment, one-click rollback button), the author of the change, and a history of recent deployments for this service. This context eliminates information hunting — the approver has everything they need to make a fast, informed decision.
Configurable Timeouts and Emergency Hotfix Lane
For approvals that are not security-critical, teams can configure a timeout-based auto-advance: if no action is taken within 30 minutes (configurable), the deploy proceeds automatically. This prevents a missed notification from blocking the entire pipeline. The timeout is logged for audit purposes.
When production is on fire, waiting for an approval cycle is unacceptable. We built an emergency hotfix lane — a special pipeline path that skips non-critical gates (SAST analysis, code coverage thresholds) while preserving essential ones (secret detection, critical vulnerability scanning). The hotfix lane deploys directly to production, is flagged in the audit log as an emergency deployment, and triggers a post-mortem pipeline that runs the skipped gates retroactively and creates follow-up tickets for any issues found.
Multi-Environment Promotion on Our Platform
Our platform does not just deploy to production — it promotes artifacts through a series of environments, each with progressively stricter validation. The promotion model we built ensures that what reaches production has been verified in environments that closely mirror production behavior.
Policy-Driven Promotion
Promotion between environments is governed by policies, not ad-hoc decisions. The policy for promoting from dev to staging might require: all unit tests pass, code coverage exceeds 75 percent, no critical or high vulnerabilities detected. The policy for promoting from staging to production is stricter: all integration tests pass, performance benchmarks meet SLO thresholds, security scans pass at production strictness, and the approval gate is satisfied. These policies are versioned alongside pipeline definitions, ensuring that promotion criteria are auditable and reviewable — critical for customers operating under SOC 2 or HIPAA compliance frameworks.
Environment-Specific Configuration Injection
While the pipeline is standardized across environments, application configuration is not. Each environment has its own database connection strings, API endpoints, feature flags, resource limits, and replica counts. These configurations are managed separately from application code and injected at deploy time based on the target environment. Our platform supports environment-scoped variables: teams define DATABASE_URL once as an environment variable, and Atmosly injects the correct value for dev, staging, and production based on the deployment target. Secrets follow the same pattern, pulled from the appropriate secret store path for each environment.
Namespace Isolation on Kubernetes
Each environment on our platform maps to a dedicated Kubernetes namespace or a dedicated cluster for production. Namespace-level ResourceQuotas prevent one environment from consuming resources allocated to another. NetworkPolicies restrict cross-namespace traffic, so staging cannot accidentally call production services. RBAC policies limit who can access each namespace — developers can kubectl into dev and staging but not production. This isolation model, which we discuss further in our guide on EKS cost optimization, ensures that environments are truly independent while sharing the same underlying infrastructure for cost efficiency.
Standardized Pipeline Templates
A common anti-pattern we saw before building our platform was having different pipeline definitions for different environments — a dev pipeline that skips tests, a staging pipeline that runs tests but not security scans, a production pipeline that runs everything. This leads to surprises: code that worked in staging fails in production because the production pipeline runs additional validation steps. Our platform enforces a single pipeline definition with environment-specific parameters. The same stages run in every environment; only the strictness of the gates and the target cluster change. This guarantees that if a build passes in staging, it will pass the same checks in production. Customers use this guarantee to demonstrate compliance with SOC 2 requirements around standardized deployment processes and HIPAA requirements around consistent production controls.
Observability: How We Monitor Hundreds of Pipelines
Most teams invest heavily in monitoring their production applications but treat their CI/CD pipeline as a black box. We think that is a mistake. When our platform processes hundreds of pipeline executions daily, the pipeline infrastructure is as critical as production — if the pipeline goes down, no code ships, and engineering velocity drops to zero for every customer on the platform. We built pipeline observability into our platform with the same rigor we apply to production services.
Dashboard Metrics
Key metrics we track and surface to customers on our platform:
- P50 / P95 / P99 build times — Median, 95th percentile, and 99th percentile build times, broken down by service, team, and stage. A P50 of 4 minutes with a P99 of 18 minutes indicates that most builds are fast but outliers need investigation.
- Queue wait time — Time between a pipeline being triggered and its first stage starting execution. This directly measures resource contention. Our platform alerts when queue wait time exceeds 2 minutes.
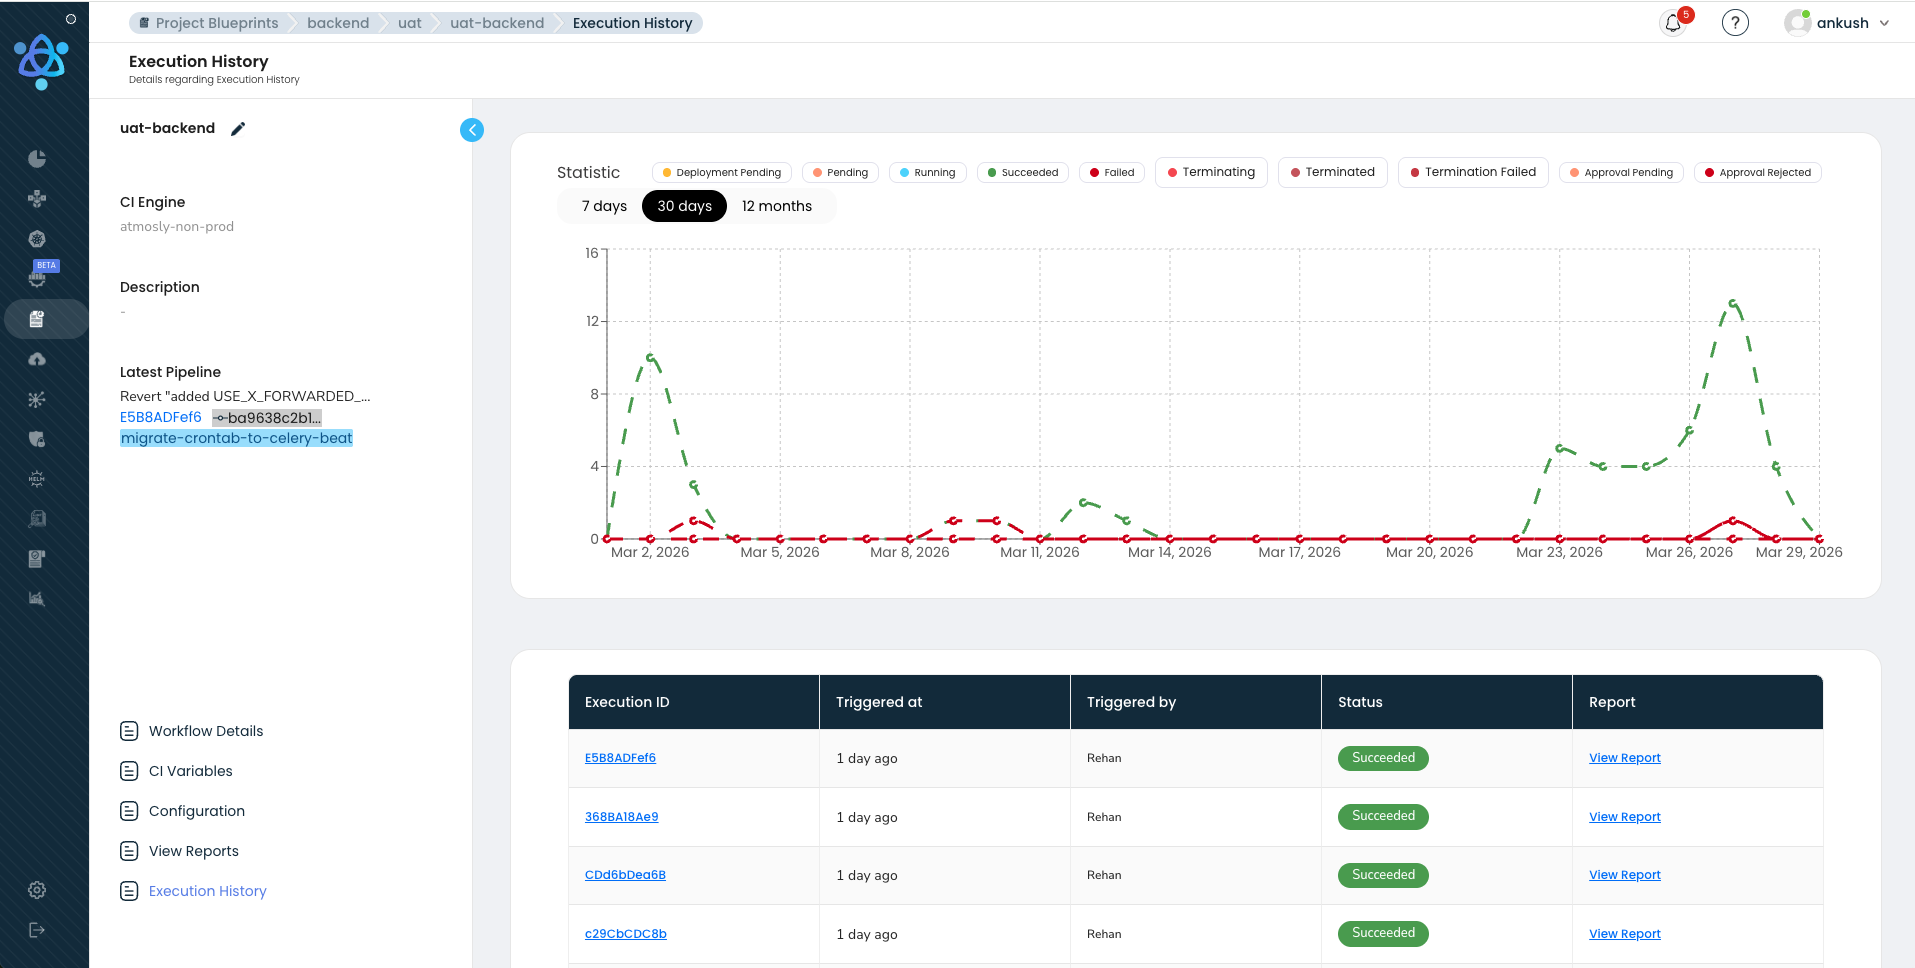
- Failure rate by stage — Percentage of pipeline runs that fail, broken down by failure type (test failure, build error, security gate, infrastructure issue). A healthy pipeline has a failure rate under 5 percent.
- Lead time to production — Time from commit push to verified production deployment. The end-to-end metric that matters most.
- Rollback frequency — How often production deployments are rolled back. A rollback rate above 5 percent indicates quality issues upstream, and our platform surfaces this trend proactively.
Alerting
Our platform generates alerts on several conditions: average build time regression (P95 build time increased by more than 20 percent week-over-week), failure rate spike (failure rate jumped from baseline by more than 2x), queue depth warning (more than 10 pipelines waiting for execution resources), and cache hit rate degradation (Docker layer cache hit rate dropped below 80 percent). We use anomaly detection rather than static thresholds because a 5 percent failure rate might be normal for one service's flaky integration tests and a crisis for another service's unit tests.
Flaky Test Detection
A test suite with a 2 percent flake rate sounds acceptable until you run it hundreds of times a day. At that frequency, you will see multiple false failures every day. Engineers learn to distrust the tests, start re-running pipelines just in case, and eventually begin ignoring failures altogether. Our platform automatically detects tests that pass and fail intermittently. We track flake rates per test over a rolling window. Tests that exceed a flake threshold (for example, 3 percent over 7 days) are quarantined — moved to a non-blocking suite while the owning team investigates. AI-assisted pattern recognition identifies common flaky test patterns: timing-dependent assertions, uncontrolled external dependencies, test ordering bugs. Our flaky test dashboard shows the top flakiest tests, their flake rate trend, and the estimated wasted pipeline time they cause.
Resource Utilization and Cost Attribution
Every pipeline run consumes compute resources that have a dollar cost. Our platform tracks resource utilization per customer, per team, per pipeline — CPU-seconds, memory-seconds, storage, network egress. This data powers cost attribution dashboards that help platform teams answer questions like: which service's pipeline is the most expensive to run? Is it worth investing in better caching for Service X if it would save $200 per month in compute costs? Should Team Y's heavy integration test suite run on every push or only on merges to main? Cost visibility drives efficiency across the platform without requiring top-down mandates.
The Tradeoffs We Made Building This Platform
Every architecture involves tradeoffs. Here are the four most significant tradeoffs in our platform, what we gave up, what we gained, and why we believe the gains outweigh the costs for the majority of teams deploying to Kubernetes. Understanding these tradeoffs is essential context for anyone comparing our approach to alternatives like those discussed in our Spinnaker vs ArgoCD comparison or our GitOps vs Traditional CI/CD architecture guide.
Tradeoff 1: Visual Builder vs YAML-First
What we gave up: Git-versioned pipeline definitions as the primary interface. Power users who prefer vim and a terminal may find a visual builder less flexible for complex pipeline logic like dynamic stage generation or matrix builds.
What we gained: 90 percent faster pipeline setup — minutes instead of hours. Self-service onboarding for teams that do not have deep CI/CD expertise. Visual debugging — customers see exactly where a pipeline failed and why without reading hundreds of lines of YAML. Cross-team standardization because everyone uses the same building blocks. Reduced configuration drift because the visual model enforces a structured schema.
Mitigation: Every visual pipeline compiles to a declarative spec that can be exported, versioned in Git, and edited as code. The visual builder is a convenience layer, not a constraint.
Tradeoff 2: Kubernetes-Only
What we gave up: Support for non-Kubernetes deployment targets — bare-metal servers, VM-based deployments, Lambda functions, ECS tasks. Teams that have not adopted Kubernetes cannot use our deployment layer.
What we gained: Deep Kubernetes-native integration that is impossible in a platform-agnostic tool. Native support for Deployments, StatefulSets, DaemonSets, CronJobs, and custom resources. Built-in understanding of rollout strategies, health checks, and resource management. Namespace isolation, RBAC integration, and cluster-aware deployment topologies across EKS, GKE, and AKS.
Mitigation: Our CI layer (build, test, scan) works regardless of deployment target. Teams can use our build pipeline and connect an external deployment tool for non-Kubernetes targets.
Tradeoff 3: Opinionated Defaults
What we gave up: Maximum flexibility in initial configuration. Our defaults — security scanning on by default, health checks required, rollback always available — may not match every team's existing process.
What we gained: Onboarding time measured in minutes, not days. New services get a fully functional, secure, best-practices pipeline from the first commit. Teams spend less time debating pipeline configuration and more time shipping features. Security is not something teams opt into — it is the default state of every pipeline on our platform.
Mitigation: Every default is overridable. Teams can customize caching keys, security scan thresholds, approval policies, deployment strategies, and notification channels.
Tradeoff 4: Parallel-First Execution
What we gave up: The mental simplicity of a linear pipeline. Parallel execution introduces complexity in debugging (which branch failed?) and resource management (more concurrent pods consuming resources).
What we gained: A 3-4x reduction in pipeline wall-clock time. This is the single biggest factor enabling hundreds of daily pipeline executions on our platform. Without parallel execution, the verification phase alone would take 8 or more minutes instead of 3 minutes. The time savings compound across every pipeline run on the platform — hundreds of runs times 5 minutes saved equals tens of hours of developer wait time eliminated daily.
Mitigation: Our visual builder makes parallelism explicit — customers see which stages run in parallel and which are sequential. The DAG model ensures stages only run in parallel when their dependencies are genuinely satisfied. The orchestrator handles all fan-out, fan-in, and failure propagation complexity so customers do not have to.
Inside a Real Customer Pipeline
Theory is useful, but a concrete example makes the architecture tangible. Here is the actual pipeline for a payment-service — a Go microservice running on Kubernetes that processes financial transactions. This is representative of what our fintech customers run in production. This pipeline runs 8 to 12 times per day for this one service.
Multiply by dozens of services across the customer's organization, and you see how we reach hundreds of daily pipeline executions on our platform.
PAYMENT-SERVICE PIPELINE — push to main
═══════════════════════════════════════════════════════════════

Stage 1: BUILD                                    [0:00 - 2:00]
├── Checkout source (8s)
├── Restore dependency cache (go.sum hash: a1b2c3) (12s)
├── go build ./cmd/payment-service (45s)
├── Docker build with BuildKit + registry cache (40s)
├── Push image: registry.io/payment-service:abc123 (15s)
└── Generate SBOM with Syft (10s)

Stage 2: VERIFY (parallel)                        [2:00 - 5:00]
├── Unit tests: go test ./... -count=1 (110s)      ✓ 847/847
├── Trivy scan: registry.io/payment-service:abc123  ✓ 0 CRITICAL, 2 LOW
├── SonarQube analysis: quality gate PASSED          ✓ Coverage 84.2%
├── detect-secrets: scan source tree                 ✓ 0 secrets found
└── OPA policy check: validate k8s manifests         ✓ 12/12 policies pass

Stage 3: DEPLOY STAGING                           [5:00 - 6:30]
├── Update Helm values: tag → abc123
├── Deploy to cluster: staging-us-east-1
├── Wait for rollout: 3/3 pods ready (45s)
└── Smoke tests: /health ✓, /api/v1/status ✓, POST /payments ✓

Stage 4: APPROVAL GATE                            [6:30 - 6:35]
├── Risk assessment: LOW (no migrations, no auth changes)
└── Auto-approved per policy (low-risk, all gates passed)

Stage 5: DEPLOY PRODUCTION (canary)               [6:35 - 8:35]
├── Canary 5%: 1 pod deployed, 5-min SLO check
│   ├── P99 latency: 42ms (baseline: 40ms) ✓
│   ├── Error rate: 0.00% ✓
│   └── Memory: 156MB / 512MB limit ✓
├── Canary 25%: traffic shifted, 3-min SLO check   ✓
├── Canary 50%: traffic shifted, 2-min SLO check   ✓
└── Canary 100%: full promotion, old RS scaled down

Stage 6: POST-DEPLOY VERIFY                       [8:35 - 9:30]
├── Readiness: 6/6 pods healthy
├── Smoke tests: all endpoints responding
├── SLO gate (10-min window): P99 42ms, errors 0.00%
└── Deployment recorded: payment-service@abc123 → prod

═══════════════════════════════════════════════════════════════
TOTAL: 9 minutes 30 seconds — push to verified production
═══════════════════════════════════════════════════════════════
Nine and a half minutes from git push to verified production deployment. That is what our platform delivers. The key enablers: parallel verification (Stage 2 runs five checks simultaneously), our three-layer caching (build takes 2 minutes instead of 12), risk-based auto-approval (low-risk changes skip human review), and canary deployment with automated SLO gates (production safety without manual monitoring). This pipeline runs 8-12 times per day for this service alone. Across dozens of services in the customer's organization, our platform orchestrates hundreds of pipeline executions daily — each following this same pattern, each isolated, each observable, each compliant with the organization's security policies.
Notice what is not in this pipeline: no manual Docker builds, no SSH into servers, no hand-crafted kubectl commands, no copy-pasting image tags between systems, no Slack messages asking someone to approve a deploy. Every step is automated by our platform, every decision is codified, and every outcome is recorded. This is the kind of pipeline customers build using Atmosly's visual pipeline builder, as explored in our guide on moving from Jenkins to visual CI/CD platforms.
How Our Engine Compares
How does our architecture compare to the CI/CD tools most teams are already using? The following comparison illustrates where our purpose-built, Kubernetes-native platform with visual orchestration fills gaps that general-purpose tools leave open. For deeper context on the GitOps dimension, see our GitOps vs Traditional CI/CD architecture guide.
| Dimension | Jenkins | GitHub Actions | GitLab CI | ArgoCD | Atmosly |
|---|---|---|---|---|---|
| Initial Setup Time | Days to weeks (install, configure, plugins) | Minutes (YAML in repo) | Minutes (built-in) | Hours (K8s operator install + config) | Minutes (connect repo, auto-generated pipeline) |
| Kubernetes Integration | Plugin-based, manual kubectl | Manual via actions, no native K8s awareness | Agent-based, moderate K8s support | Deep — K8s-native GitOps controller | Deep — native cluster management, namespace isolation, rollout strategies |
| Security Scanning | Via plugins (fragmented, inconsistent) | Via marketplace actions (user-configured) | Built-in SAST/DAST/SCA (Ultimate tier) | Not included (CI responsibility) | Built-in: Trivy, SonarQube, detect-secrets, OPA, SBOM — parallel execution, on by default |
| Deployment Strategies | Manual scripting for each strategy | Manual scripting | Basic environment support | Rolling, blue-green, canary via Argo Rollouts | Rolling, blue-green, canary with visual config, automated SLO gates, 1-click rollback |
| Visual Pipeline Builder | Blue Ocean (deprecated, limited) | None (YAML only) | Pipeline editor (basic) | None (YAML/manifest only) | Full drag-and-drop DAG builder with real-time execution visualization |
| Rollback Speed | Manual — re-run old build or revert | Manual — re-run workflow | Manual — re-run pipeline | Fast — Git revert triggers sync | Instant — 1-click rollback to any previous deployment, automated canary rollback |
| Parallel Execution | Supported but complex to configure | Matrix strategy (good) | DAG-based (good) | N/A (CD only) | DAG-based with visual builder, automatic parallelism detection |
| Multi-Cluster Support | Custom scripting per cluster | Manual via separate workflows | Agent per cluster | Native multi-cluster (ApplicationSet) | Native multi-cluster with environment promotion, namespace isolation, per-cluster config |
| Build Caching | Node-local only (breaks on multi-node) | actions/cache (good, limited to 10GB) | Built-in cache (moderate) | N/A (CD only) | Registry-backed Docker cache, lockfile-keyed dependency cache, shared artifact volumes |
| Pipeline Observability | Basic — logs and build history | Basic — logs and status checks | Moderate — analytics in Ultimate tier | ArgoCD dashboard (deployment-focused) | Full: P50/P95/P99 build times, failure analytics, queue metrics, cost tracking, flaky test detection |
| Scale (concurrent pipelines) | Limited by controller resources | Concurrency limits per org | Runner-dependent | N/A (CD only) | Hundreds of concurrent runs with queue prioritization, tenant isolation, resource pools |
| Maintenance Burden | High — self-hosted, plugin updates, agent management | Low — managed service | Medium — self-hosted or managed | Medium — K8s operator lifecycle | Low — managed platform, no infrastructure to maintain |
The key differentiator is integration depth combined with platform-grade scale. Jenkins, GitHub Actions, and GitLab CI are general-purpose CI/CD tools that can be configured to do almost anything — but that configuration burden falls on your team, and scaling them to hundreds of concurrent pipelines across a multi-tenant organization requires significant engineering investment. ArgoCD excels at GitOps-based continuous delivery but does not handle CI. Our platform provides an integrated solution covering the entire pipeline — from code push to verified production deployment — with native Kubernetes support, built-in security scanning, visual orchestration, advanced deployment strategies, and the scale infrastructure to handle hundreds of daily pipeline executions without degradation.
Getting Started with Our Platform
If you have read this far, you are either building a platform-grade CI/CD engine from scratch or looking to replace an existing setup that has hit a scale ceiling. Either way, here is how to get started on our platform and experience what hundreds of daily pipeline executions feel like when the infrastructure just works.
Step 1: Connect your first repository. Our platform auto-detects your application stack — language, framework, Dockerfile, test configuration — and generates a pipeline template. You will have a working build-test-scan-deploy pipeline in under 10 minutes, with security scanning enabled by default. No YAML to write. No plugins to install. Start your free 14-day trial.
Step 2: Connect your Kubernetes cluster. Whether you run EKS, GKE, AKS, or on-prem Kubernetes, Atmosly connects to your cluster and provides namespace isolation, deployment management, and rollout strategies without requiring additional operators or CRDs.
Step 3: Configure your deployment strategy. Choose rolling updates for routine changes, blue-green for zero-downtime database migrations, or canary with SLO gates for user-facing services. Configure once in our visual builder — every subsequent deploy uses the same strategy automatically.
Step 4: Scale to your organization. Use pipeline templates to standardize delivery across teams. Set up promotion policies for dev, staging, and production. Enable observability dashboards. Let teams self-serve their own pipelines while platform engineering maintains governance through policies, not gatekeeping. As your organization grows from tens to hundreds of daily pipeline executions, our platform scales with you.
Have questions or want to see a demo tailored to your infrastructure? Talk to our team — we have helped platform engineering teams go from fragmented, manually-configured CI/CD to a unified engine handling hundreds of daily pipeline executions, and we would be happy to walk through how our architecture maps to your environment.
Conclusion: What It Takes to Run Hundreds of Pipelines a Day
We built Atmosly's CI/CD engine on a core belief: platform-grade continuous delivery is not about making one team fast. It is about building an engine that makes every team fast — simultaneously, securely, and observably. Our four-layer architecture — event ingestion, pipeline orchestration, execution engine, and deployment verification — provides the structural foundation that scales from tens to hundreds of daily pipeline executions without degradation. Our three-layer caching architecture slashes build times by 70 percent, making high-frequency execution practical on reasonable infrastructure. Our parallel security pipeline eliminates the tradeoff between safety and speed. Our deployment strategies — rolling, blue-green, and canary with automated SLO gates — keep production stable even as dozens of teams deploy continuously throughout the day. And our observability layer ensures that we see every bottleneck, every failure pattern, and every degradation trend before our customers do.
The engineering problems we solved — tenant isolation, burst traffic handling, queue prioritization, atomic state transitions across hundreds of concurrent runs, multi-cloud deployment orchestration — are the problems that separate a single-team CI/CD setup from a platform that organizations depend on every day. These are not solved-once problems. We continue to invest in our engine's performance, reliability, and observability because the moment our CI/CD platform becomes unreliable is the moment every customer's engineering velocity drops to zero.
Hundreds of pipeline executions flow through our engine every day. Builds compile, tests run, security scanners sweep, deployments roll out, verification checks pass. Across fintech, healthcare, e-commerce, and SaaS — across EKS, GKE, and AKS — across dozens of teams and hundreds of services. That is the scale story. Not one team doing 50 deploys. An engine that powers continuous delivery for organizations that depend on it.
Ready to experience platform-grade CI/CD? Start your free 14-day trial with Atmosly and go from code push to production in under 10 minutes.