Introduction to Kubernetes Monitoring: Why Observability is Mission-Critical
Kubernetes monitoring is the systematic practice of collecting, storing, analyzing, and acting upon telemetry data from your Kubernetes clusters to ensure optimal performance, maintain service reliability, optimize resource utilization, control cloud infrastructure costs, and enable rapid troubleshooting when issues inevitably occur. In modern production environments running business-critical applications on Kubernetes, effective comprehensive monitoring is not optional, not a nice-to-have feature, not something to implement "eventually when we have time"???it is absolutely mission-critical infrastructure that must be in place from day one of production deployment, because without proper monitoring you are fundamentally flying blind, unable to detect incidents until customers start complaining, unable to troubleshoot root causes efficiently, unable to optimize costs burning thousands of dollars monthly in waste, and unable to demonstrate compliance with service level agreements or regulatory requirements.
As Kubernetes clusters grow in scale and complexity???managing hundreds of microservices distributed across dozens of nodes, orchestrating thousands of ephemeral pods that come and go constantly, processing petabytes of data through distributed systems, and handling millions of requests per day from global user bases???monitoring becomes exponentially more challenging than traditional infrastructure monitoring ever was. The fundamental characteristics of Kubernetes that make it powerful for running modern applications (dynamic pod scheduling, automatic scaling, self-healing through restarts, rolling deployments with gradual rollouts) simultaneously make monitoring dramatically harder because resources are constantly changing, traditional static monitoring built around fixed hostnames and IP addresses completely breaks, and the sheer volume of metrics from thousands of containers overwhelms conventional monitoring systems designed for dozens or hundreds of relatively static virtual machines.
Traditional monitoring approaches that worked perfectly fine for static virtual machine infrastructure or bare metal servers for decades simply fall apart when applied to the dynamic, distributed, ephemeral nature of containerized workloads orchestrated by Kubernetes at scale. You cannot rely on monitoring individual pod hostnames because they change every deployment. You cannot monitor fixed IP addresses because pods get new IPs when they restart. You cannot depend on long-term metric retention at the pod level because pods are deleted and recreated constantly, taking their identity and history with them. You cannot use simple host-based alerting because pods move between nodes dynamically based on scheduling decisions and resource availability.
This comprehensive technical guide teaches you everything you need to know about implementing production-grade Kubernetes monitoring from foundational concepts to advanced practices, covering: why Kubernetes monitoring presents unique challenges that traditional tools cannot address, what specific metrics actually matter for maintaining reliability versus vanity metrics that consume resources without providing value, which monitoring tools and platforms are available in 2025 with honest pros/cons analysis, how to set up Prometheus and Grafana as the open-source standard, how to configure automatic service discovery avoiding manual configuration nightmares, how to implement effective alerting that catches real issues without creating alert fatigue, monitoring best practices based on Google's Site Reliability Engineering principles and real-world production experience, how to correlate metrics with logs and events for comprehensive troubleshooting, and how modern AI-powered platforms like Atmosly are revolutionizing Kubernetes monitoring by providing automatic issue detection within 30 seconds, AI-generated root cause analysis correlating metrics with logs and events automatically, natural language query interfaces eliminating the need to learn PromQL, cost intelligence showing resource waste alongside performance metrics enabling simultaneous reliability and cost optimization, and smart alerting that reduces notification noise by 80% while catching real problems faster through baseline learning and anomaly detection rather than static thresholds that generate endless false positives.
By completing this guide and implementing the monitoring strategies it teaches, you'll transform your Kubernetes operations from reactive firefighting where you only discover problems after customer impact to proactive optimization where you detect issues before they affect users, troubleshoot root causes in minutes instead of hours through correlated telemetry, continuously optimize resource allocation reducing cloud costs by 30-40% without impacting performance, demonstrate compliance with SLAs and regulatory requirements through comprehensive audit trails, and gain the visibility and confidence needed to deploy changes faster because you trust your monitoring to catch problems immediately rather than discovering issues days later through bug reports.
The Unique Challenges of Kubernetes Monitoring
Challenge 1: Ephemeral and Dynamic Resources
In traditional infrastructure monitoring, you monitor servers with stable identities???server001 has been running for 6 months with the same hostname, same IP address, and predictable behavior patterns. Kubernetes destroys this model completely. Pods are ephemeral by design, existing for minutes, hours, or days before being replaced. Every deployment creates new pods with new names. Autoscaling constantly creates and destroys pods based on load. Failed pods are automatically restarted with different names and IPs. This constant churn makes traditional monitoring built around static resource identities completely ineffective.
Specific problems this creates:
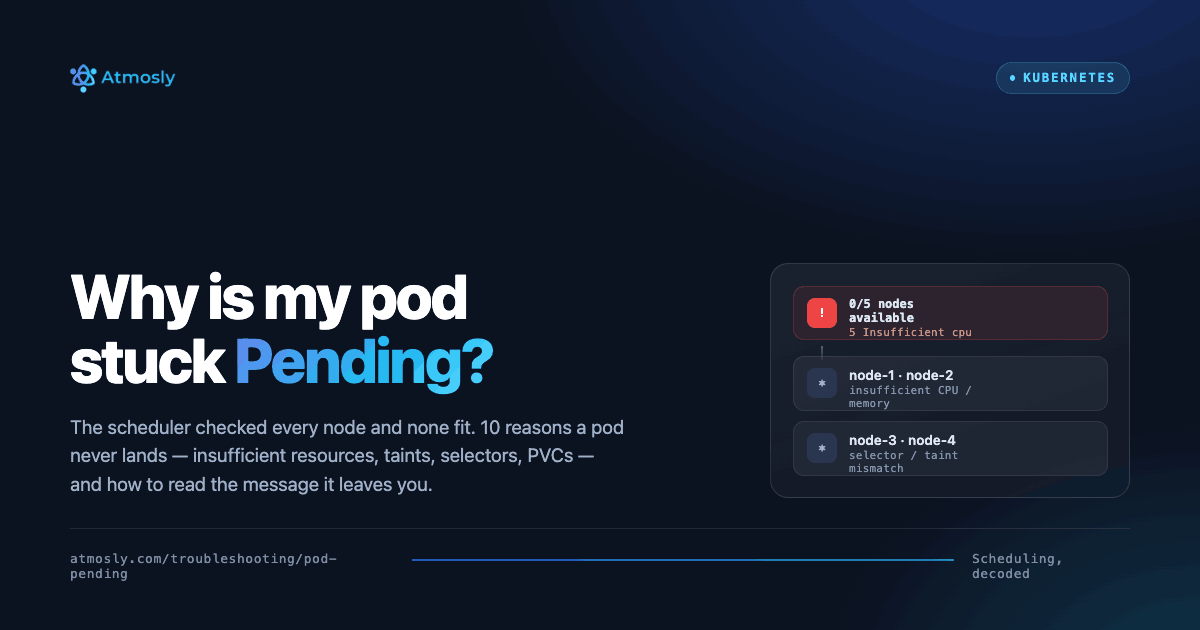
- Cannot alert on "server001 CPU > 80%" because there is no server001???just payment-service-7d9f8b-xyz that might not exist tomorrow
- Historical metrics for specific pods become meaningless after pod deletion???you need aggregation by deployment/service
- Dashboards showing individual pod metrics must handle pods appearing and disappearing constantly
- Alert configurations must use label selectors (app=frontend) not hostnames
How Prometheus solves this: Label-based time-series model where metrics have labels like {namespace="production", deployment="frontend", pod="frontend-abc123"}. Queries aggregate by deployment, not individual pods, making monitoring resilient to pod churn.
Challenge 2: Multi-Layer Complexity Requiring Holistic Visibility
Kubernetes monitoring isn't just about watching application metrics???you must monitor simultaneously across four distinct layers:
- Infrastructure Layer: Physical or virtual machine nodes providing compute, memory, storage, network. Node failures cascade into pod evictions and service degradation.
- Kubernetes Orchestration Layer: Control plane components (API server, etcd, scheduler, controller-manager) managing cluster state and orchestration. Control plane problems cause cluster-wide failures.
- Container Layer: Individual container resource consumption, restart patterns, health check status. Container issues often indicate application bugs or configuration problems.
- Application Layer: Business logic metrics (request rates, error rates, latency, throughput, custom business metrics). This is what actually matters to users and business.
Missing visibility at any layer creates blind spots. Monitoring only applications without infrastructure means you can't distinguish between application bugs and infrastructure problems. Monitoring only infrastructure without applications means you don't know if users are experiencing slow responses despite healthy infrastructure metrics.
Essential Metrics Every Kubernetes Cluster Must Monitor
Node and Infrastructure Metrics (Foundation Layer)
CPU Metrics:
node_cpu_seconds_total: Cumulative CPU time by mode (idle, user, system, iowait)kube_node_status_capacity_cpu_cores: Total CPU cores per nodekube_node_status_allocatable_cpu_cores: CPU available for pod scheduling (capacity minus system reserved)
Memory Metrics:
node_memory_MemTotal_bytes: Total physical memorynode_memory_MemAvailable_bytes: Available for new allocations (critical for scheduling)node_memory_MemFree_bytes: Completely unused (small due to cache)kube_node_status_allocatable_memory_bytes: Memory available for pods
Pod and Container Metrics (Workload Health)
kube_pod_status_phase{phase="Pending|Running|Succeeded|Failed|Unknown"}: Pod lifecycle statekube_pod_container_status_restarts_total: Container restart count (CrashLoopBackOff indicator)container_cpu_usage_seconds_total: Actual CPU consumedcontainer_memory_working_set_bytes: Actual memory used (what triggers OOMKill)kube_pod_container_resource_requests: Requested resources (for scheduling)kube_pod_container_resource_limits: Resource limits (throttling/OOMKill thresholds)
Control Plane Metrics (Cluster Health)
apiserver_request_duration_seconds: API server latency (slow API affects everything)apiserver_request_total: API request rate and errorsetcd_disk_wal_fsync_duration_seconds: etcd disk write latency (critical for performance)scheduler_schedule_attempts_total: Scheduling success vs failure
Best Kubernetes Monitoring Tools in 2025: Comprehensive Comparison
Tool 1: Prometheus + Grafana (Open-Source Industry Standard)
Prometheus, created by SoundCloud in 2012 and now a CNCF graduated project, has become the de facto standard for Kubernetes monitoring. It was specifically designed for cloud-native environments.
Architecture and How It Works:
Prometheus uses a pull-based model where it scrapes metrics from HTTP endpoints exposed by applications and infrastructure. It stores metrics as time-series data (metric name + labels + timestamp + value) in local disk optimized for append-only writes and time-range queries. PromQL query language enables powerful aggregations and analysis.
Comprehensive Feature Analysis:
- ??? Free and Open Source: No licensing costs, community-driven development
- ??? Native Kubernetes Integration: Service discovery automatically finds pods
- ??? Powerful Query Language: PromQL enables complex analysis
- ??? Built-in Alerting: Alertmanager handles notification routing
- ??? Massive Ecosystem: Exporters for everything, huge community
- ??? Battle-Tested at Scale: Proven in production at Google-scale deployments
- ??? Manual Setup Required: Complex Helm installation, configuration, dashboard creation
- ??? No Long-Term Storage: Default 15-day retention, requires Thanos/Cortex for longer
- ??? Learning Curve: PromQL takes weeks to master
- ??? No Cost Visibility: Shows only performance metrics, not cloud costs
- ??? Limited AI/ML: No anomaly detection or intelligent insights
- ??? Maintenance Burden: Ongoing Helm upgrades, storage management, tuning
Best for: Teams with Kubernetes expertise, those wanting full control and customization, organizations already invested in Prometheus ecosystem, or those requiring on-premises deployment
Tool 2: Datadog (Commercial SaaS Platform)
Pros:
- ??? Minimal setup (agent deployment)
- ??? Excellent UI/UX
- ??? APM integration (metrics + traces + logs unified)
- ??? Good correlation capabilities
- ??? Pre-built dashboards
Cons:
- ??? Expensive: $15-31 per host per month + infrastructure costs = $10K-50K/month for medium clusters
- ??? Data egress costs for multi-cloud
- ??? Vendor lock-in
- ??? Still requires PromQL knowledge for advanced queries
Best for: Large enterprises with budget, teams prioritizing ease of use over cost
Tool 3: New Relic (Full-Stack Observability)
Pros: User-friendly, good APM, flexible pricing tiers
Cons: Expensive for large clusters, less Kubernetes-specific than specialized tools
Tool 4: Atmosly (AI-Powered Platform Engineering Solution)
Atmosly takes a fundamentally different approach: Instead of just collecting and storing metrics for humans to analyze manually, Atmosly uses AI to automatically understand what metrics mean, detect issues proactively, identify root causes through multi-source correlation, and provide specific remediation recommendations???transforming monitoring from a passive data collection system into an active intelligent assistant that makes your team dramatically more effective.
Core Capabilities That Set Atmosly Apart:
- Automatic Health Detection (30-Second Detection): Atmosly's health monitoring system continuously watches your cluster detecting CrashLoopBackOff, ImagePullBackOff, OOMKilled, Pending pods, failed deployments, and 20+ other common Kubernetes failure patterns within 30 seconds of occurrence, far faster than human review of dashboards
- AI Root Cause Analysis: When issues are detected, Atmosly's AI automatically retrieves pod status, container logs (current and previous), Kubernetes events, Prometheus metrics, and related resource states, then correlates all data sources to identify the actual root cause???not just symptoms???and generates comprehensive RCA reports with timeline reconstruction, contributing factors, impact assessment, and specific recommended fixes
- Real-Time Metrics Integration: Seamlessly connects to your existing Prometheus setup if you have one, auto-discovering prometheus-operator-kube-p-prometheus services in monitoring namespace, or deploys complete Prometheus stack if you don't, enhancing traditional metrics with AI-powered insights rather than replacing your investment
- Cost Intelligence (Unique to Atmosly): Monitors resource utilization metrics (CPU/memory usage vs requests vs limits) alongside actual cloud provider billing data through API integrations, identifies over-provisioned pods wasting money, calculates exact monthly waste per pod/deployment/namespace, and provides optimization recommendations with one-command kubectl fixes achieving typical 30% cost reduction
- Proactive Health Monitoring: 30-second continuous health check intervals across all pods, smart reporting that only notifies on actual actionable issues (not noise like single pod restarts that Kubernetes handles automatically), and early warning alerts for trending problems like gradual memory leaks before they cause OOMKills
- Natural Language Troubleshooting: Ask questions in plain English like "Why is my payment-service pod crashing?" or "Show me pods using too much memory in production namespace" and receive actionable answers with specific kubectl commands to execute, eliminating the need to master PromQL syntax or remember dozens of kubectl command variations
- Zero Setup Monitoring: Deploys as lightweight agent in your cluster with single kubectl apply command, monitoring starts automatically within 5 minutes without Helm chart configuration, values.yaml editing, dashboard creation, or alert rule writing???dramatically reducing time-to-value compared to 4-6 hours typical Prometheus manual setup
How Atmosly Works With Existing Prometheus:
If you already have Prometheus + Grafana running (which many teams do), Atmosly doesn't replace it???it enhances and augments your existing investment:
- Connects to your Prometheus service automatically (discovers prometheus-operator-kube-p-prometheus in monitoring namespace)
- Queries historical metrics using PromQL to provide cost and performance analysis
- Correlates Prometheus metrics with pod events from Kubernetes API and logs from containers for comprehensive RCA
- Adds AI-powered anomaly detection that traditional Prometheus alerting rules cannot provide (learns baselines automatically rather than requiring manual threshold configuration)
- Shows cost impact alongside performance metrics (Prometheus shows CPU usage %, Atmosly shows CPU usage % + $X/month waste if under-utilized)
If You Don't Have Monitoring Yet:
Atmosly provides complete monitoring solution:
- One-click Prometheus stack deployment via Helm addons if desired
- Pre-configured Grafana dashboards optimized for Kubernetes (no manual dashboard creation)
- Automated alerting rules based on industry best practices and SRE principles
- Or use Atmosly's built-in monitoring without Prometheus at all for maximum simplicity
Real-World Impact Example:
A SaaS company with 200-node Kubernetes cluster running microservices architecture implemented Atmosly and achieved:
- 97% MTTR Reduction: Average troubleshooting time dropped from 2 hours to 8 minutes through AI-powered RCA
- 32% Cost Reduction: Identified $18,000/month in over-provisioned resources through automated resource analysis
- 85% Alert Noise Reduction: Smart alerting with baseline learning reduced false-positive alerts from 150/week to 22/week
- Detection Speed: Issues detected in 30 seconds vs 15-45 minutes manual dashboard review
Setting Up Kubernetes Monitoring: Implementation Approaches
Approach 1: DIY Prometheus + Grafana (4-6 Hours Setup)
[Comprehensive Prometheus installation guide with kube-prometheus-stack...]
Approach 2: Atmosly Automated Monitoring (5 Minutes Setup)
[Quick Atmosly deployment guide...]
Monitoring Best Practices for Production Kubernetes
1. Implement the Four Golden Signals
Google's SRE book defines four critical metrics...
1. Use Resource Requests and Limits for Accurate Monitoring
2. Monitor at Multiple Layers
3. Set Up Effective Alerting
4. Correlate Metrics with Logs and Events
How Atmosly Transforms Kubernetes Monitoring
[Detailed Atmosly capabilities section...]
Conclusion: The Future of Kubernetes Monitoring
Kubernetes monitoring has evolved from basic metric collection to AI-powered intelligent observability. Modern teams need automated issue detection, intelligent alerting, root cause analysis, cost visibility, and developer-friendly tools.
Whether you choose DIY Prometheus/Grafana or an AI-powered platform like Atmosly, comprehensive monitoring is non-negotiable for production Kubernetes.
Ready to take your Kubernetes monitoring to the next level? Start your free Atmosly trial and experience AI-powered monitoring that reduces MTTR by 90% and cloud costs by 30%.