.webp)
Introduction
Kubernetes has become the cornerstone of modern container orchestration, but its complexity can lead to various challenges, especially when troubleshooting issues. In this comprehensive guide, we will delve into Kubernetes troubleshooting, covering common errors, best practices, and strategies for effective issue resolution.???
What is Kubernetes Troubleshooting?
Kubernetes troubleshooting is the process of identifying, diagnosing, and resolving issues within Kubernetes clusters, nodes, pods, or containers. As Kubernetes has become the de facto standard for container orchestration, understanding how to troubleshoot it effectively is essential for maintaining the reliability, performance, and availability of containerized applications.
At its core, Kubernetes troubleshooting involves investigating and resolving problems that can occur at various levels of the Kubernetes environment. This includes issues related to cluster infrastructure, such as networking, storage, and compute resources, as well as application-level problems, such as misconfigured pods, failing deployments, or performance bottlenecks.
The troubleshooting process typically begins with identifying symptoms or indicators of a problem, such as error messages, warning signs, or abnormal behaviour observed within the Kubernetes environment. Once symptoms are identified, the next step is to diagnose the underlying cause of the issue, which may involve examining logs, metrics, configurations, or events generated by Kubernetes components.
Once the root cause of the problem is identified, the final step is to implement solutions or workarounds to resolve the issue and restore normal operation. This may involve configuration changes, adjusting resource allocations, restarting components, rolling back deployments, or applying patches or updates to Kubernetes or related software.
Effective Kubernetes troubleshooting requires a combination of technical expertise, problem-solving skills, and familiarity with Kubernetes concepts, architecture, and components. It also relies on tools and techniques for monitoring, logging, and debugging Kubernetes environments, such as kubectl, Kubernetes Dashboard, Prometheus, Grafana, or third-party monitoring solutions.???
The Three Pillars of Kubernetes Troubleshooting
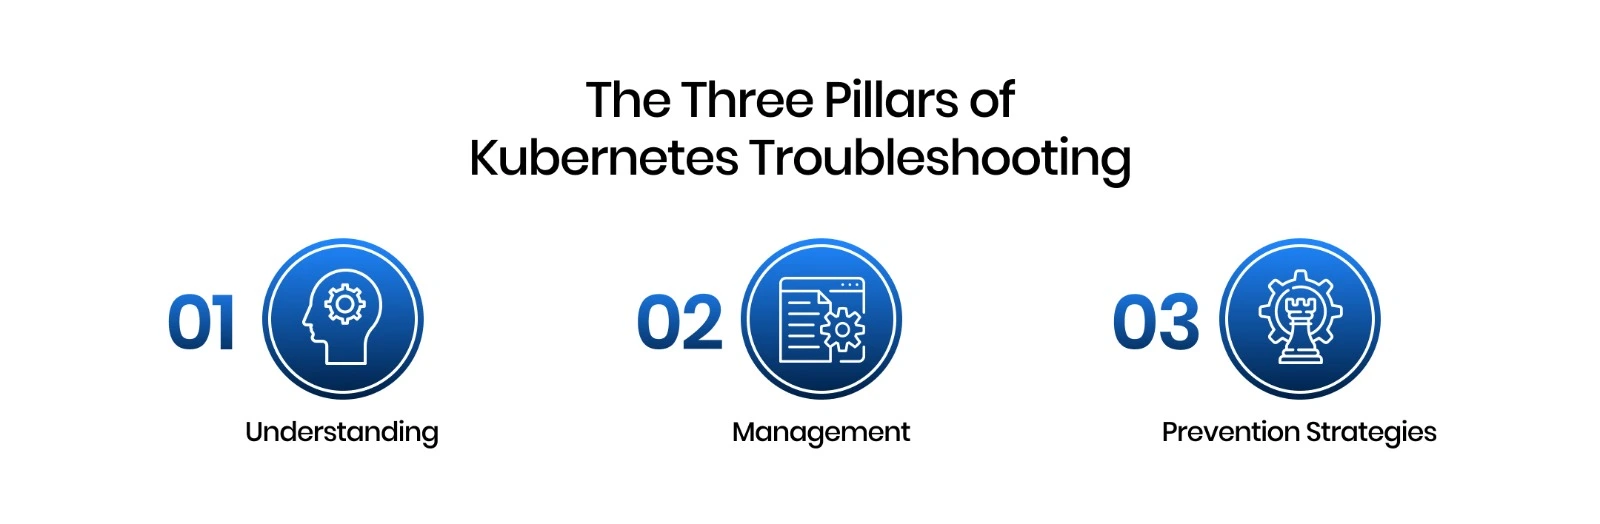
Understanding Kubernetes Troubleshooting
In Kubernetes environments, troubleshooting can often be challenging due to the distributed nature of the system and the complexity of containerized applications. Understanding what happened and identifying the root cause of the problem is essential for effective troubleshooting. This typically involves several steps:
- Reviewing Recent Changes: Begin by reviewing recent changes to the affected cluster, pod, or node to understand what might have caused the failure. Changes could include updates to configurations, deployments, or application code. Tools like version control systems (e.g., GitHub) and configuration management tools can help track these changes.
- Analyzing Configurations and Logs: Dive into YAML configurations, GitHub repositories, and logs for VMs or bare metal machines running the malfunctioning components. These sources can provide valuable insights into the state of the system before, during, and after the failure. Monitoring tools and logging solutions, such as Splunk or Logz.io, are commonly used for this purpose.
- Monitoring and Metrics Analysis: Utilize monitoring tools to gather metrics such as disk pressure, memory pressure, and resource utilization. Dashboards displaying important metrics for clusters, nodes, pods, and containers over time can help identify trends and abnormalities. Tools like Datadog, Grafana, or New Relic are popular choices for monitoring Kubernetes environments.
- Comparing Component Behavior: Compare the behavior of similar components that are functioning correctly with those experiencing issues. Analyze dependencies between components to determine if they are related to the failure. This comparative analysis can help narrow down potential causes and identify areas for investigation.
To facilitate these troubleshooting efforts, teams leverage various technologies and tools:
Monitoring Tools: Datadog, Dynatrace, Grafana, New Relic
Live Debugging Tools: OzCode, Rookout
Logging Tools: Splunk, LogDNA, Logz.io, ELK , Loki
???Management in Kubernetes Troubleshooting
In a microservices architecture common in Kubernetes environments, incidents often involve multiple components managed by separate teams. Collaboration and effective incident management are crucial for fast remediation of problems. Once the issue is understood, there are typically three approaches to remediation:
- Ad Hoc Solutions: Teams may rely on tribal knowledge and expertise from engineers who built the affected components. This unwritten knowledge can provide valuable insights into how to debug and resolve issues quickly.
- Manual Runbooks: Document clear procedures for resolving each type of incident in runbooks. Having well-documented runbooks enables every team member to follow standardized processes for issue resolution, reducing ambiguity and minimizing downtime.
- Automated Runbooks: Implement automated processes triggered automatically when an issue is detected. These automated runbooks can take the form of scripts, infrastructure as code (IaC) templates, or Kubernetes operators. While automating responses to all common incidents can be challenging, it offers significant benefits by reducing downtime and eliminating human error.
To support these management practices, teams leverage various technologies and tools:
Incident Management: PagerDuty, Kintaba
Project Management: Jira, Monday, Trello
Infrastructure as Code: Amazon CloudFormation, Terraform
Prevention Strategies in Kubernetes Troubleshooting
Prevention is key to reducing the time and effort invested in identifying and troubleshooting new issues. Successful teams prioritize prevention by implementing proactive measures. Strategies for preventing production issues in Kubernetes include:
- Creating Policies and Playbooks: Establish policies, rules, and playbooks after every incident to ensure effective remediation. These documents serve as guidelines for addressing similar issues in the future, enabling teams to respond more efficiently.
- Automation of Responses: Investigate opportunities to automate responses to common issues. By automating repetitive tasks and remediation actions, teams can reduce the likelihood of human error and minimize downtime.
- Defining Monitoring and Escalation Procedures: Define how to identify issues quickly and make relevant data available for troubleshooting. Implement monitoring and alerting systems to detect abnormalities promptly, and ensure clear escalation procedures are in place to involve the appropriate teams when needed.
To support these prevention efforts, teams commonly use the following technologies and practices:
Chaos Engineering: Gremlin, Chaos Monkey, ChaosIQ
Auto Remediation: Shoreline, OpsGenie???
Why is Kubernetes Troubleshooting so Difficult?
Kubernetes, with its ability to orchestrate containerized applications across clusters of nodes, offers unparalleled flexibility, scalability, and resilience. However, this complexity also presents significant challenges when it comes to troubleshooting. Several factors contribute to the difficulty of troubleshooting Kubernetes environments:
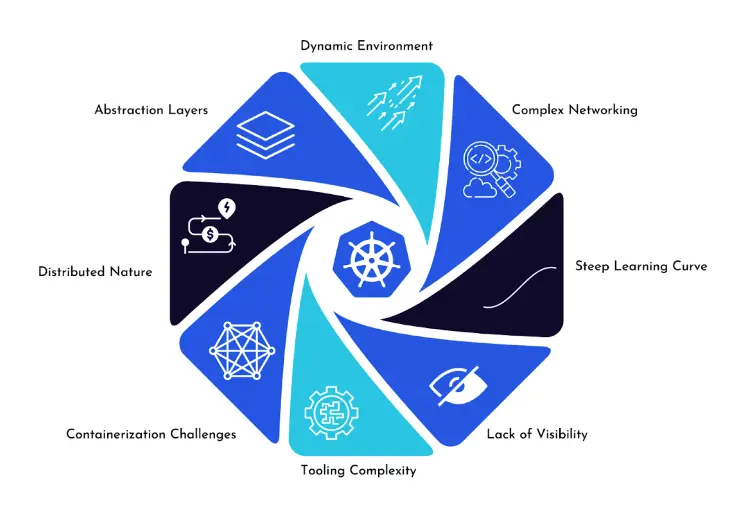
- Distributed Nature: Kubernetes operates in a highly distributed environment where applications are deployed across multiple nodes and containers. This distributed architecture makes it challenging to pinpoint the exact location and cause of issues, especially when problems span multiple components or nodes.
- Abstraction Layers: Kubernetes abstracts away many underlying infrastructure details, such as networking, storage, and compute resources, through its APIs and resource abstractions. While this abstraction simplifies application deployment and management, it also introduces additional layers of complexity, making it harder to diagnose and resolve issues at the infrastructure level.
- Dynamic Environment: Kubernetes is designed to be dynamic and self-healing, with components constantly scaling up, down, or relocating based on demand and resource availability. While this dynamic nature improves resource utilization and application availability, it also introduces variability and unpredictability, making it challenging to replicate and debug issues reliably.
- Complex Networking: Kubernetes networking, including service discovery, load balancing, and network policies, is inherently complex. Issues related to network connectivity, DNS resolution, or firewall rules can be particularly challenging to diagnose and troubleshoot due to the distributed and abstracted nature of Kubernetes networking.
- Containerization Challenges: Containers, while offering numerous benefits such as portability and isolation, also introduce their own set of challenges. Debugging issues within containers, accessing containerized logs, and diagnosing application-specific problems can be more complex compared to traditional monolithic applications running on virtual machines.
- Lack of Visibility: Despite Kubernetes providing built-in monitoring and logging capabilities, achieving comprehensive visibility into the entire stack, including applications, infrastructure, and networking, can be difficult. Inadequate monitoring, insufficient logging, or misconfigured alerting can further exacerbate the challenge of troubleshooting Kubernetes environments.
- Steep Learning Curve: Kubernetes is a sophisticated platform with a steep learning curve. Mastery of concepts such as pods, deployments, services, and controllers, as well as proficiency in using kubectl commands and understanding Kubernetes API objects, requires time and experience. Without a solid understanding of Kubernetes fundamentals, troubleshooting becomes significantly more challenging.
- Tooling Complexity: While Kubernetes ecosystem offers a plethora of tools and utilities for monitoring, logging, tracing, and debugging, navigating this tooling landscape can be overwhelming. Choosing the right tools, configuring them effectively, and integrating them seamlessly into the Kubernetes environment requires careful consideration and expertise.
Troubleshooting Common Kubernetes Errors
In the complex landscape of Kubernetes orchestration, encountering errors is inevitable. Effectively troubleshooting these errors is essential for maintaining the stability and performance of your Kubernetes clusters. Here's a look at some common Kubernetes errors and how to identify them:
1. CreateContainerConfigError
This error occurs when Kubernetes is unable to create a container due to configuration issues.
How to Identify the Issue:
Identification Steps:
Check Pod Events: Use the command kubectl describe pod <pod-name> to examine the events associated with the pod. Look for events related to container creation failure.
kubectl describe pod <pod-name>Inspect Container Configuration: Review the pod's YAML configuration file to ensure that the container's configuration, including environment variables, volume mounts, and resource requests/limits, is correctly specified.
kubectl get pod <pod-name> -o yamContainer Logs: Retrieve the logs of the container using kubectl logs <pod-name> -c <container-name>. Look for any error messages or stack traces that indicate configuration problems.
kubectl logs <pod-name> -c <container-name>Verify Image Availability: Ensure that the container image referenced in the pod's configuration exists and is accessible from the Kubernetes cluster. Check the image name, tag, and repository URL for accuracy.
kubectl get pod <pod-name> -o=jsonpath='{.spec.containers[*].image}'???
2. ImagePullBackOff or ErrImagePull
This error occurs when Kubernetes fails to pull the specified container image during pod initialization.
???How to Identify the Issue:
Identification Steps:
Check Pod Status: Use kubectl get pods to view the status of pods in the cluster. Look for pods with the ImagePullBackOff or ErrImagePull status.
kubectl get podsInspect Pod Events: Execute kubectl describe pod <pod-name> to examine events related to image pulling. Look for error messages indicating authentication failures, network connectivity issues, or invalid image references.
kubectl describe pod <pod-name>Verify Image Name and Tag: Ensure that the image name and tag specified in the pod's YAML configuration file are correct. Check for typos and ensure that the image exists in the specified repository.
kubectl get pod <pod-name> -o=jsonpath='{.spec.containers[*].image}'Check Image Registry Access: Verify that the Kubernetes nodes have network connectivity to the container image registry and that any required authentication credentials (e.g., Docker credentials, image pull secrets) are properly configured.
kubectl get secret <registry-secret-name> -o jsonpath="{.data.\.dockerconfigjson}" | base64 --decode
3. CrashLoopBackOff
This error occurs when a container repeatedly crashes immediately after starting, causing Kubernetes to restart it in a loop.
How to Identify the Issue:
Identification Steps:
Examine Pod Logs: Retrieve the logs of the crashing container using kubectl logs <pod-name> -c <container-name>. Look for error messages, exceptions, or segmentation faults that indicate application failures.
kubectl logs <pod-name> -c <container-name>Check Resource Limits: Review the resource limits and requests specified for the container in the pod's YAML configuration file. Ensure that the container has adequate CPU and memory resources to run without crashing.
kubectl describe pod <pod-name>Inspect Application Configuration: Verify the correctness of the application's configuration files and environment variables. Look for misconfigurations or dependencies that may be causing the container to crash.
kubectl exec -it <pod-name> -- <command to check application configMonitor Node Resources: Monitor system resources (CPU, memory, disk) on the Kubernetes nodes hosting the pod. High resource utilization or resource contention may contribute to container crashes.
kubectl top nodes???
4. Kubernetes Node Not Ready
This error occurs when a Kubernetes node is not ready to accept pods, usually due to network connectivity issues, resource exhaustion, or system failures.
???How to Identify the Issue:
Identification Steps:
View Node Status: Execute kubectl get nodes to view the status of all nodes in the cluster. Look for nodes in the NotReady state.
kubectl get nodeCheck Node Conditions: Use kubectl describe node <node-name> to inspect the conditions and events associated with the node. Look for conditions such as Ready, NetworkUnavailable, DiskPressure, MemoryPressure, and OutOfDisk.
kubectl describe node <node-name>Monitor Node Resources: Monitor system resources (CPU, memory, disk) on the node using system monitoring tools or commands like top, vmstat, or df. Resource exhaustion may prevent the node from becoming ready.
topvmstatdReview Node Logs: Check the Kubernetes node logs (/var/log/messages, /var/log/syslog) for any errors or warnings that may indicate network issues, kernel panics, or hardware failures affecting node readiness.
cat /var/log/messagescat /var/log/syslogTroubleshooting Kubernetes Pods: A Quick Guide
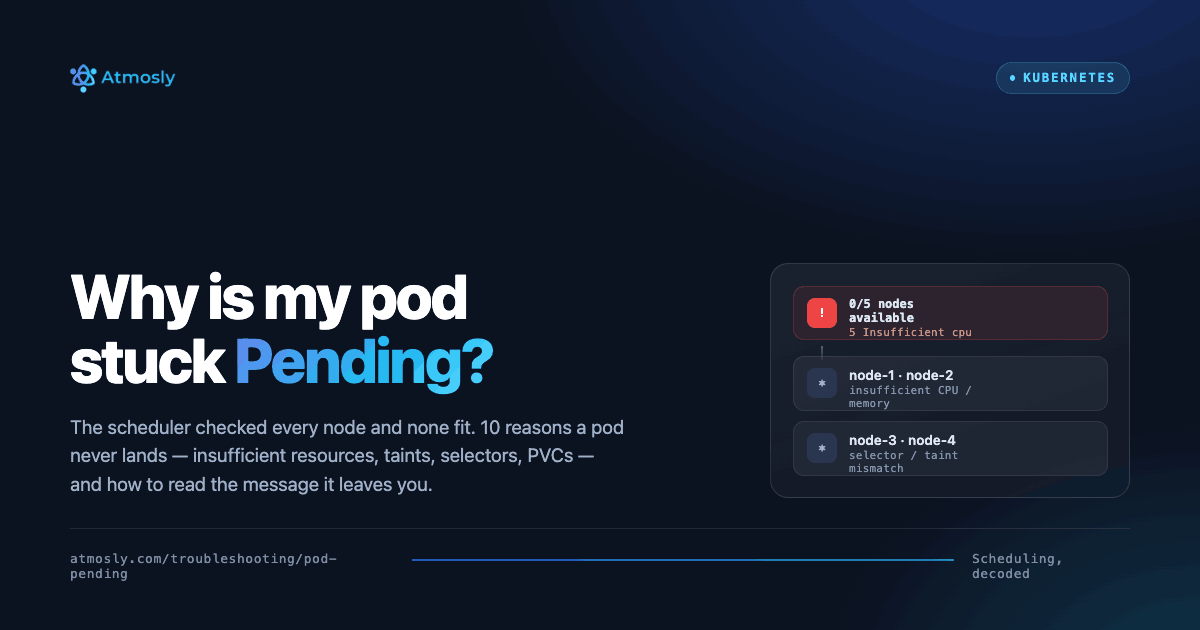
Kubernetes pods are the fundamental building blocks of applications deployed on Kubernetes clusters. They encapsulate one or more containers, along with shared storage and networking resources. When pods encounter issues, it's crucial to diagnose and resolve them promptly to ensure the reliability and availability of your applications. Here's a quick guide to troubleshooting Kubernetes pods:
Check Pod Status:
The first step in troubleshooting a Kubernetes pod is to check its status. You can use the kubectl get pods command to list all pods in a namespace along with their current status. Common pod states include Running, Pending, Completed, CrashLoopBackOff, Error, and Terminating. Understanding the pod's current state provides valuable insights into the nature of the problem.
Inspect Pod Events:
Kubernetes maintains a log of events associated with each pod. You can retrieve these events using the kubectl describe pod <pod-name> command. Examining pod events helps identify any errors or warnings logged by Kubernetes during pod initialization, scheduling, or execution.
Review Pod Logs:
Containerized applications typically write logs to STDOUT and STDERR streams, which Kubernetes collects and stores. You can retrieve container logs using the kubectl logs <pod-name> command. Reviewing pod logs can help pinpoint application-specific errors or issues that occurred during container startup or execution.
Examine Pod Configuration:
Check the pod's configuration, including its YAML definition, to ensure correctness. Pay attention to container specifications, volume mounts, environment variables, and resource requests/limits. Misconfigurations in pod specifications can lead to runtime errors or failures.
Inspect Resource Constraints:
Kubernetes allows you to define resource requests and limits for pods, such as CPU and memory. Insufficient resource allocations can cause pods to fail or become evicted due to resource constraints. Use the kubectl describe pod <pod-name> command to view resource requests and limits defined for the pod.
Verify Network Connectivity:
???Networking issues can prevent pods from communicating with other services or accessing external resources. Check network policies, service endpoints, and pod network configurations to ensure proper connectivity within the Kubernetes cluster and beyond.
Consider Pod Eviction:
Kubernetes may evict pods under certain conditions, such as node resource exhaustion or node maintenance activities. Review cluster events and node status to determine if pod evictions occurred due to underlying infrastructure issues.
Utilize Debugging Tools:
Kubernetes ecosystem offers various debugging tools and utilities to aid in troubleshooting pods and containers. Tools like kubectl debug, kubectl exec, kubectl port-forward, and kubectl attach provide interactive debugging capabilities and access to container environments for diagnostic purposes.
Monitor Pod Health:
Implement proactive monitoring and alerting mechanisms to detect pod failures or performance degradation early. Utilize Kubernetes-native monitoring solutions or integrate with third-party monitoring tools to track pod metrics, health checks, and application-specific indicators.
Consult Documentation and Community:
Leverage official Kubernetes documentation, community forums, and online resources to seek guidance and best practices for troubleshooting common pod-related issues. Engage with the Kubernetes community to learn from others' experiences and contribute to collective knowledge sharing.
Diagnosing Other Pod Issues
While some pod issues may be straightforward to diagnose and resolve using common troubleshooting techniques, others may require a deeper understanding of Kubernetes architecture and containerized applications. In this section, we'll explore additional pod issues that may arise and how to diagnose them effectively:
Intermittent Failures:???
Pods experiencing intermittent failures can be challenging to diagnose because the issue may not manifest consistently. In such cases, focus on gathering comprehensive data during both successful and failed pod executions. Monitor pod behavior over time, analyze logs for patterns, and correlate events with environmental changes or workload fluctuations.
???Performance Degradation:
Performance degradation in pods can result from various factors, including resource contention, inefficient application code, or configuration issues. Use Kubernetes monitoring tools to track resource utilization metrics (CPU, memory, disk I/O) and identify performance bottlenecks. Profile application code and conduct performance testing to pinpoint areas for optimization.
???Dependency Issues:
Pod dependencies, such as external services or dependencies on other pods, can impact pod functionality and stability. Diagnose dependency issues by tracing requests and responses across the application stack. Verify connectivity to dependent services, check DNS resolution, and inspect network policies to ensure unrestricted communication between pods and external resources.
???Security Vulnerabilities:
Security vulnerabilities in pods pose a significant risk to the overall Kubernetes environment. Perform security audits and vulnerability scans on pod images and dependencies to identify potential risks. Implement security best practices such as image signing, runtime security controls, and pod security policies to mitigate vulnerabilities and harden pod security posture.
???Data Loss or Corruption:
Data loss or corruption within pods can occur due to software bugs, hardware failures, or improper data handling practices. Implement robust data management and backup strategies to safeguard critical application data. Monitor storage volumes and filesystem integrity within pods to detect anomalies and prevent data loss events.
???Pod Lifecycle Issues:
Pod lifecycle management encompasses various stages, including creation, scheduling, execution, and termination. Diagnose pod lifecycle issues by examining Kubernetes events, scheduler logs, and controller manager interactions. Ensure that pod controllers (e.g., ReplicaSets, Deployments) are functioning correctly and reconcile pod states according to desired specifications.
???Container Runtime Errors:
Container runtime errors, such as segmentation faults or kernel panics, can lead to pod failures and instability. Monitor container runtime logs and system-level metrics to detect abnormal behavior or runtime errors. Investigate kernel-level issues, resource exhaustion, and runtime configuration conflicts that may impact container stability.
???Application-specific Problems:
Application-specific problems within pods require a deep understanding of application architecture, dependencies, and runtime behavior. Collaborate with application developers to troubleshoot application errors, memory leaks, or performance bottlenecks. Utilize application profiling tools, distributed tracing, and APM (Application Performance Monitoring) solutions to diagnose and optimize application performance.
???Scaling Challenges:
Scaling pods to accommodate fluctuating workloads introduces challenges related to resource provisioning, load balancing, and service discovery. Monitor pod autoscaling events, review horizontal pod autoscaler (HPA) configurations, and analyze cluster-wide resource utilization trends. Implement strategies such as pod anti-affinity, affinity rules, and topology-aware scheduling to optimize pod scaling behavior.
???Custom Resource Definitions (CRDs) Issues:
Pods leveraging Custom Resource Definitions (CRDs) may encounter issues related to CRD schema validation, resource versioning, or API compatibility. Validate CRD definitions, review Kubernetes API server logs for validation errors, and ensure that CRDs are registered and managed correctly within the cluster.
Troubleshooting Kubernetes Clusters: A Quick Guide
Kubernetes clusters are complex distributed systems that manage containerized applications and their underlying infrastructure. While Kubernetes provides powerful abstractions for deploying and scaling applications, cluster administrators often encounter challenges when troubleshooting issues that affect cluster stability and performance. In this quick guide, we'll discuss common cluster failure scenarios and effective strategies for resolving them:
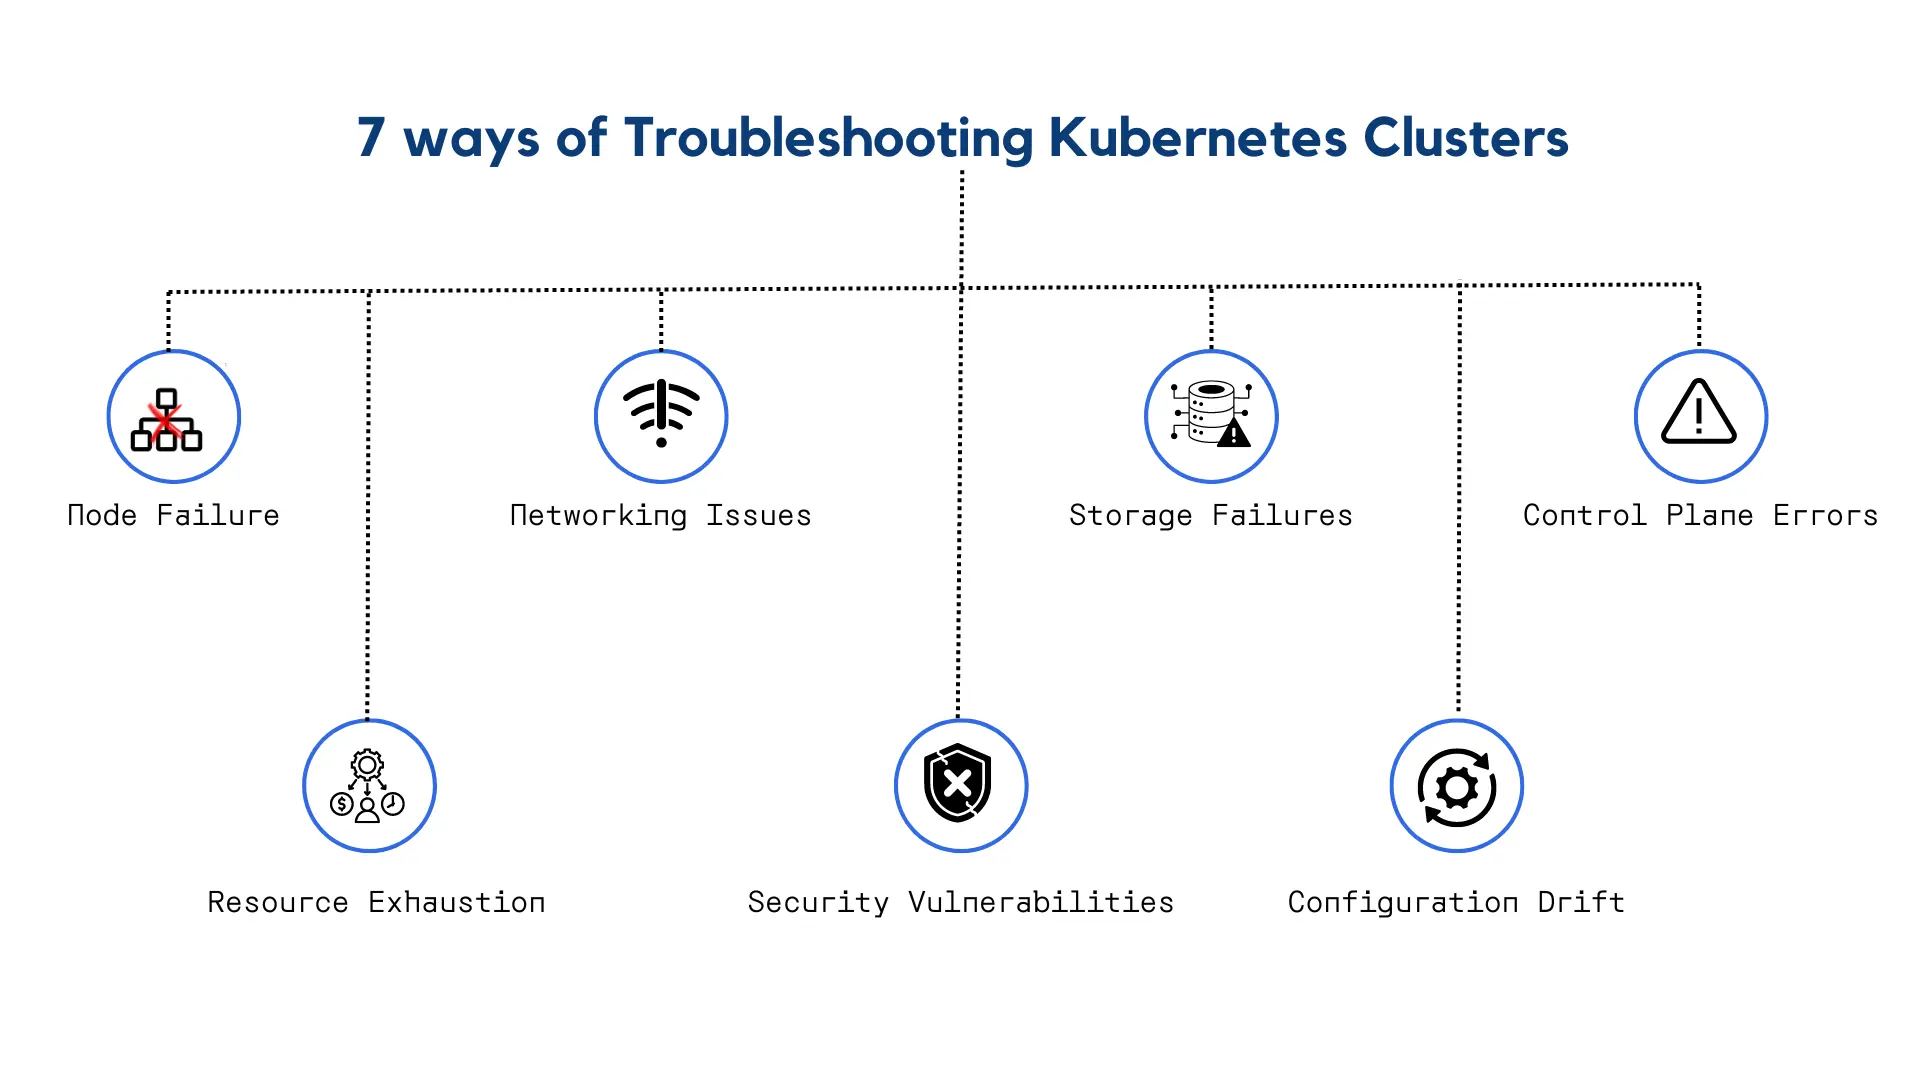
???Node Failure:
Node failures can occur due to hardware issues, kernel panics, or resource exhaustion. When a node becomes unresponsive or fails to communicate with the cluster, Kubernetes may evict pods scheduled on the affected node and reschedule them on healthy nodes. To resolve node failures, administrators should:
- Investigate node health using monitoring tools and system logs.
- Replace or repair faulty hardware components.
- Implement node redundancy and high-availability configurations to minimize downtime.
Networking Issues:
Networking problems can disrupt communication between pods, services, and external endpoints within Kubernetes clusters. Common networking issues include DNS resolution failures, network policy misconfigurations, and firewall restrictions. To troubleshoot networking issues, administrators should:
- Verify network configurations and Kubernetes networking plugins.
- Use network diagnostic tools like traceroute and tcpdump to analyze network traffic.
- Ensure consistent network policies and firewall rules across cluster nodes.
???Storage Failures:
Persistent storage is critical for stateful applications running on Kubernetes clusters. Storage failures can occur due to disk errors, volume provisioning issues, or storage provider outages. To address storage failures, administrators should:
- Validate storage class configurations and volume attachments.
- Monitor storage provider status and service-level agreements (SLAs).
- Implement data replication and backup strategies to protect against data loss.
Control Plane Errors:
The Kubernetes control plane, including the API server, scheduler, and controller manager, orchestrates cluster operations and maintains desired state configurations. Control plane errors can lead to API server crashes, scheduling bottlenecks, and resource allocation issues. To troubleshoot control plane errors, administrators should:
- Monitor control plane components for errors and performance metrics.
- Validate etcd cluster health and consistency.
- Implement control plane redundancy and disaster recovery mechanisms.
Resource Exhaustion:
Resource exhaustion occurs when pods consume excessive CPU, memory, or storage resources, leading to performance degradation and cluster instability. To mitigate resource exhaustion issues, administrators should:
- Monitor resource utilization metrics using Kubernetes monitoring tools.
- Set resource requests and limits for pods to prevent resource contention.
- Implement horizontal pod autoscaling (HPA) to dynamically adjust resource allocations based on workload demand.
Security Vulnerabilities:
Kubernetes clusters are susceptible to security vulnerabilities, including container escapes, privilege escalations, and unauthorized access. To address security vulnerabilities, administrators should:
- Apply security patches and updates to Kubernetes components and container images.
- Implement network policies, pod security policies, and RBAC controls to enforce least privilege access.
- Conduct regular security audits and penetration testing to identify and remediate vulnerabilities.
Configuration Drift:
Configuration drift occurs when cluster configurations diverge from the desired state, leading to inconsistencies and operational issues. To prevent configuration drift, administrators should:
- Use configuration management tools like GitOps and Helm to declaratively define and manage cluster configurations.
- Implement configuration validation and enforcement policies to ensure consistency across cluster environments.
- Perform regular audits and reconciliation checks to identify and correct configuration drift.
By proactively addressing these common cluster failure scenarios and adopting best practices for troubleshooting Kubernetes clusters, administrators can maintain the reliability, scalability, and resilience of their containerized applications in production environments. Regular monitoring, automated alerting, and continuous improvement are essential for effectively managing Kubernetes clusters and ensuring optimal performance and availability.
Ready to master Kubernetes troubleshooting and ensure the reliability of your containerized applications? Join Atmosly today and gain access to expert insights, comprehensive guides, and cutting-edge tools to streamline your Kubernetes operations. Take the next step towards a seamless Kubernetes experience and elevate your container orchestration game with Atmosly.
Troubleshooting clusters with OpenLens? See how Atmosly compares →
Conclusion
In the fast-paced world of container orchestration, effective troubleshooting is essential for maintaining the stability, performance, and resilience of Kubernetes environments. With Atmosly, you have a trusted partner by your side, providing invaluable resources, actionable guidance, and innovative solutions to navigate the complexities of Kubernetes troubleshooting. Whether you're a seasoned Kubernetes pro or just getting started, Atmosly empowers you to tackle challenges head-on, optimize your workflows, and unlock the full potential of Kubernetes. Join the Atmosly community today and embark on a journey towards Kubernetes excellence.